

Question: Answer all please! 4. The following table presents the average price in dollars for a dozen eggs and a gallon of milk for each month
Answer all please!
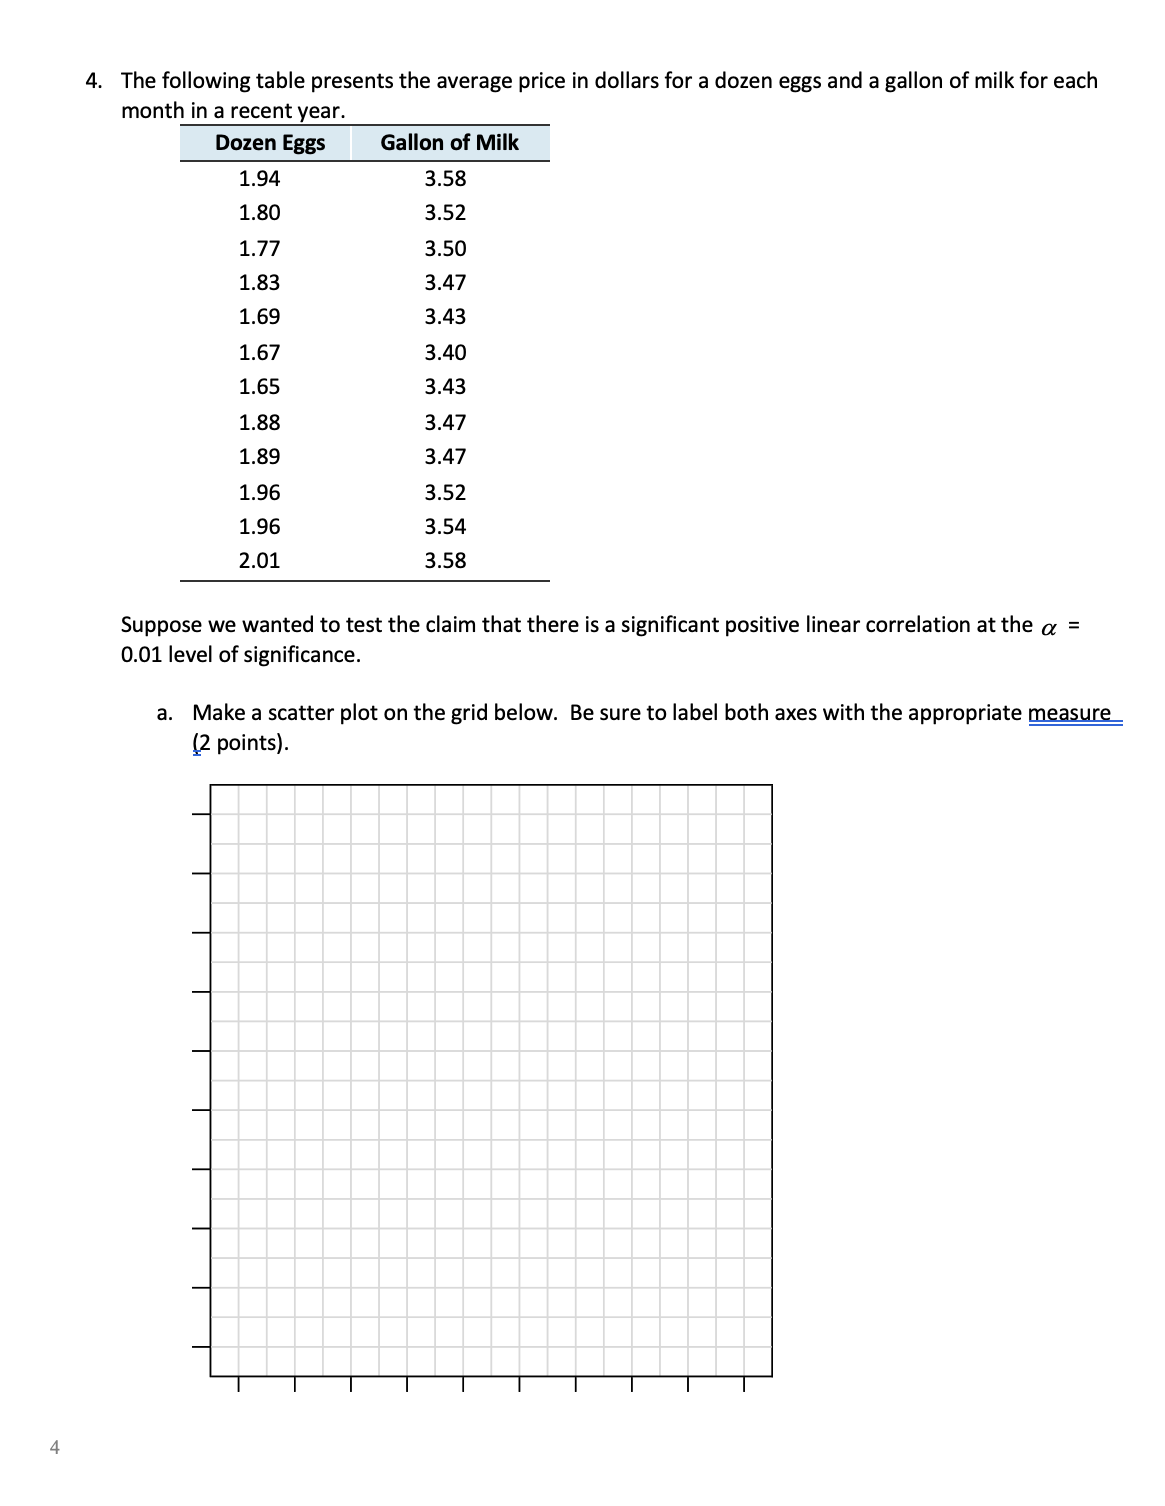
4. The following table presents the average price in dollars for a dozen eggs and a gallon of milk for each month in a recent year. Dozen Eggs Gallon of Milk 1.94 3.58 1.80 3.52 1.77 3.50 1.83 3.47 1.69 3.43 1.67 3.40 1.65 3.43 1.88 3.47 1.89 3.47 1.96 3.52 1.96 3.54 2.01 3.58 Suppose we wanted to test the claim that there is a signicant positive linear correlation at the a = 0.01 level of significance. a. Make a scatter plot on the grid below. Be sure to label both axes with the appropriate m (2 points). b. Calculate the sample correlation coefficient r. (1 point) c. State the null and alternate hypotheses for the formal hypothesis test of the correlation coefficient. (1 point) d. Give the p-value and state your conclusion for the hypothesis test.(2 points) e. Interpret the final conclusion in the context of the original claim. (3 points) f. Provide the equation of the regression line. (2 points) g. Predict the price of milk in a month when the price of eggs is $1.95. (2 points) h. Give the coefficient of determination, r-squared , and interpret what it means in the context of this problem. (2 points)
Step by Step Solution
There are 3 Steps involved in it

Get step-by-step solutions from verified subject matter experts