Question: answer all please QUESTION 4 Variation in the production process leads to: O quality defects O process improvement opportunities quality improvements product consistency service improvements

answer all please answer all please QUESTION 4 Variation in the
QUESTION 4 Variation in the production process leads to: O quality defects O process improvement opportunities quality improvements product consistency service improvements QUESTION 5 An x-bar chart is an example of what? Traditional statistical tools Fishbone diagramming Acceptance sampling Experimental design Statistical process control QUESTION 6 P-charts are used to measure: continuous variation intermittent random variation proportion of items in a sample that is defective the count of defective parts proportion of items in a sample that are good

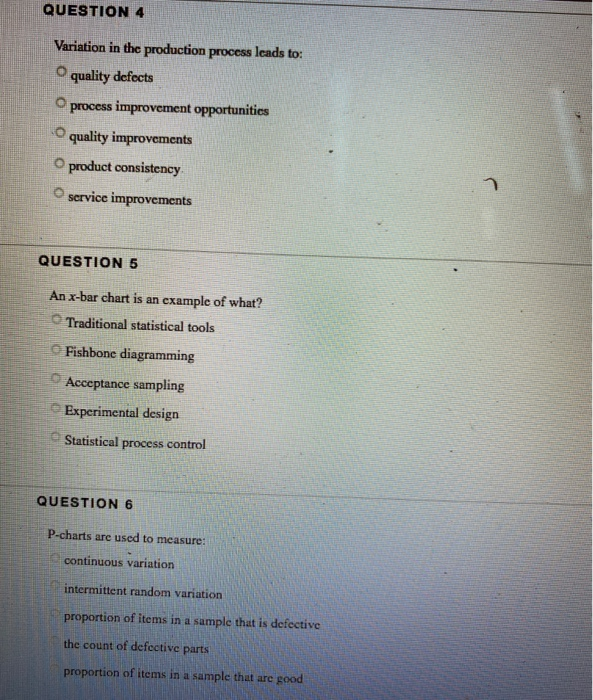
Step by Step Solution

There are 3 Steps involved in it

1 Expert Approved Answer
Step: 1 Unlock blur-text-image
Question Has Been Solved by an Expert!

Get step-by-step solutions from verified subject matter experts

Step: 2 Unlock
Step: 3 Unlock

Students Have Also Explored These Related General Management Questions!