

Question: Answer all question Q2 The results of unit root test are presented in Table 1(a) and (b) below. Briefly explain the hypothesis results. Table 1(a)
Answer all question
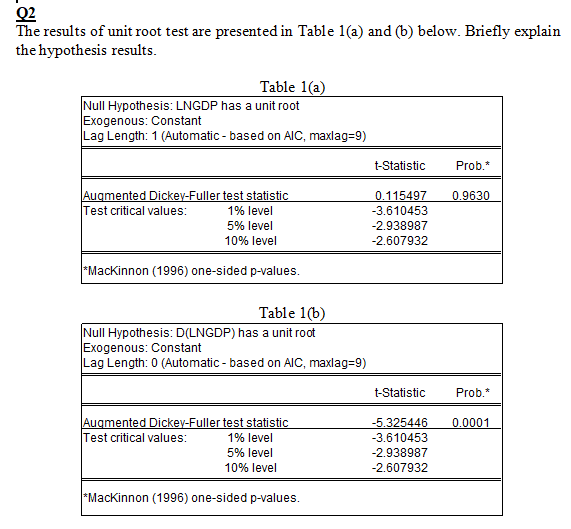
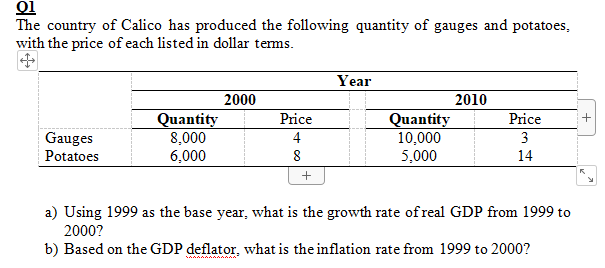
Q2 The results of unit root test are presented in Table 1(a) and (b) below. Briefly explain the hypothesis results. Table 1(a) Null Hypothesis: LNGDP has a unit root Exogenous: Constant Lag Length: 1 (Automatic - based on AIC, maxlag=9) t-Statistic Prob.* Augmented Dickey-Fuller test statistic 0.115497 0.9630 Test critical values: 1% level -3.610453 5% level -2.938987 10% level -2.607932 *Mackinnon (1996) one-sided p-values. Table 1(b) Null Hypothesis: D(LNGDP) has a unit root Exogenous: Constant Lag Length: 0 (Automatic - based on AIC, maxlag=9) t-Statistic Prob.* Augmented Dickey-Fuller test statistic -5.325446 0.0001 Test critical values: 1% level -3.610453 5% level -2.938987 10% level -2.607932 *Mackinnon (1996) one-sided p-values.The country of Calico has produced the following quantity of gauges and potatoes, with the price of each listed in dollar terms. Year 2000 2010 Quantity Price Quantity Price + Gauges 8.000 10,000 CO P Potatoes 6.000 5.000 14 + a) Using 1999 as the base year, what is the growth rate of real GDP from 1999 to 2000? b) Based on the GDP deflator, what is the inflation rate from 1999 to 2000
Step by Step Solution
There are 3 Steps involved in it

Get step-by-step solutions from verified subject matter experts