

Question: Answer ALL questions 1. The table below contains UCR data showing the 2015 rate of officer assaults (per 100 officers) in each of the four
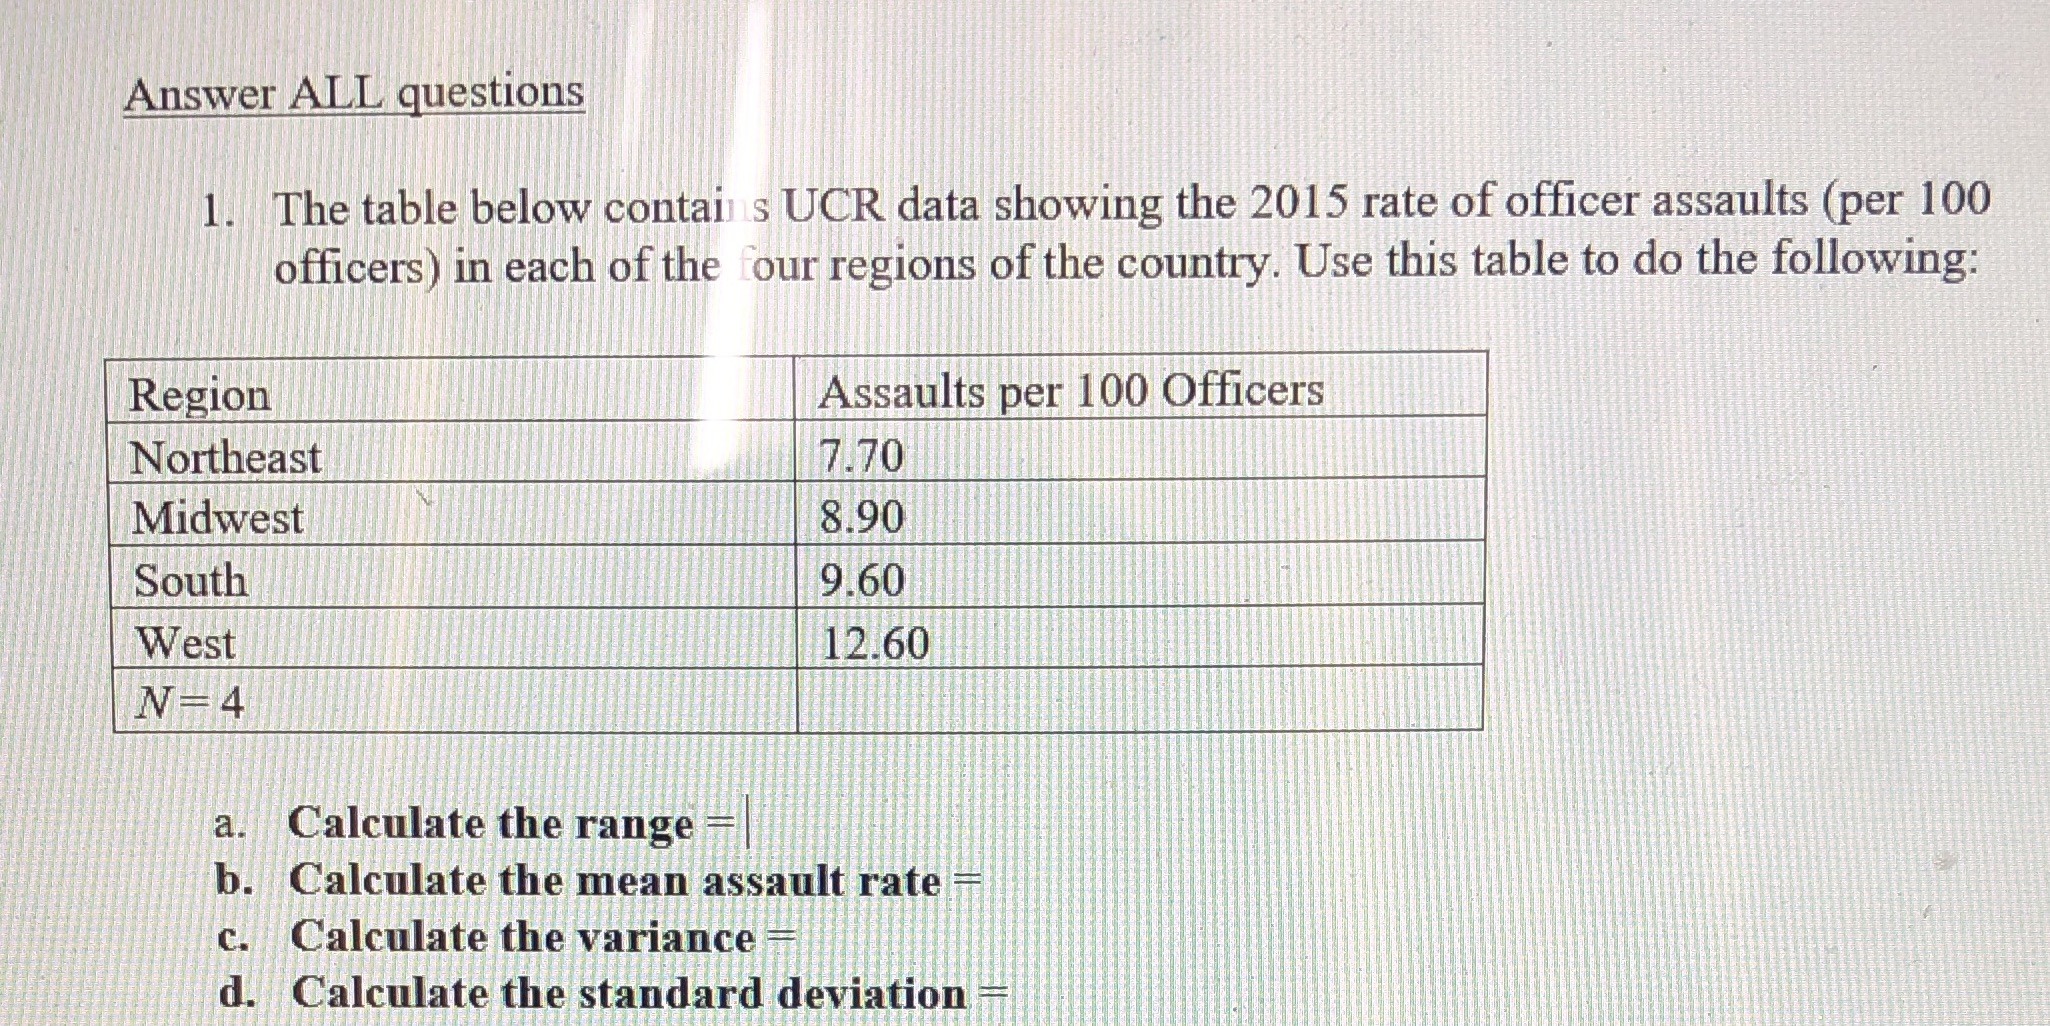
Answer ALL questions 1. The table below contains UCR data showing the 2015 rate of officer assaults (per 100 officers) in each of the four regions of the country. Use this table to do the following: Region Assaults per 100 Officers Northeast 7.70 Midwest 8.90 South 9.60 West 12.60 N-4 a. Calculate the range - b. Calculate the mean assault rate c. Calculate the variance d. Calculate the standard deviation
Step by Step Solution
There are 3 Steps involved in it
1 Expert Approved Answer
Step: 1 Unlock

Question Has Been Solved by an Expert!
Get step-by-step solutions from verified subject matter experts
Step: 2 Unlock
Step: 3 Unlock