

Question: ANSWER ALL QUESTIONS FOR A THUMBS UP RATING. IF NOT, THEN YOU WILL GET A THUMBS DOWN RATING. Normal Challenging 03 A math teacher gives


ANSWER ALL QUESTIONS FOR A THUMBS UP RATING. IF NOT, THEN YOU WILL GET A THUMBS DOWN RATING.
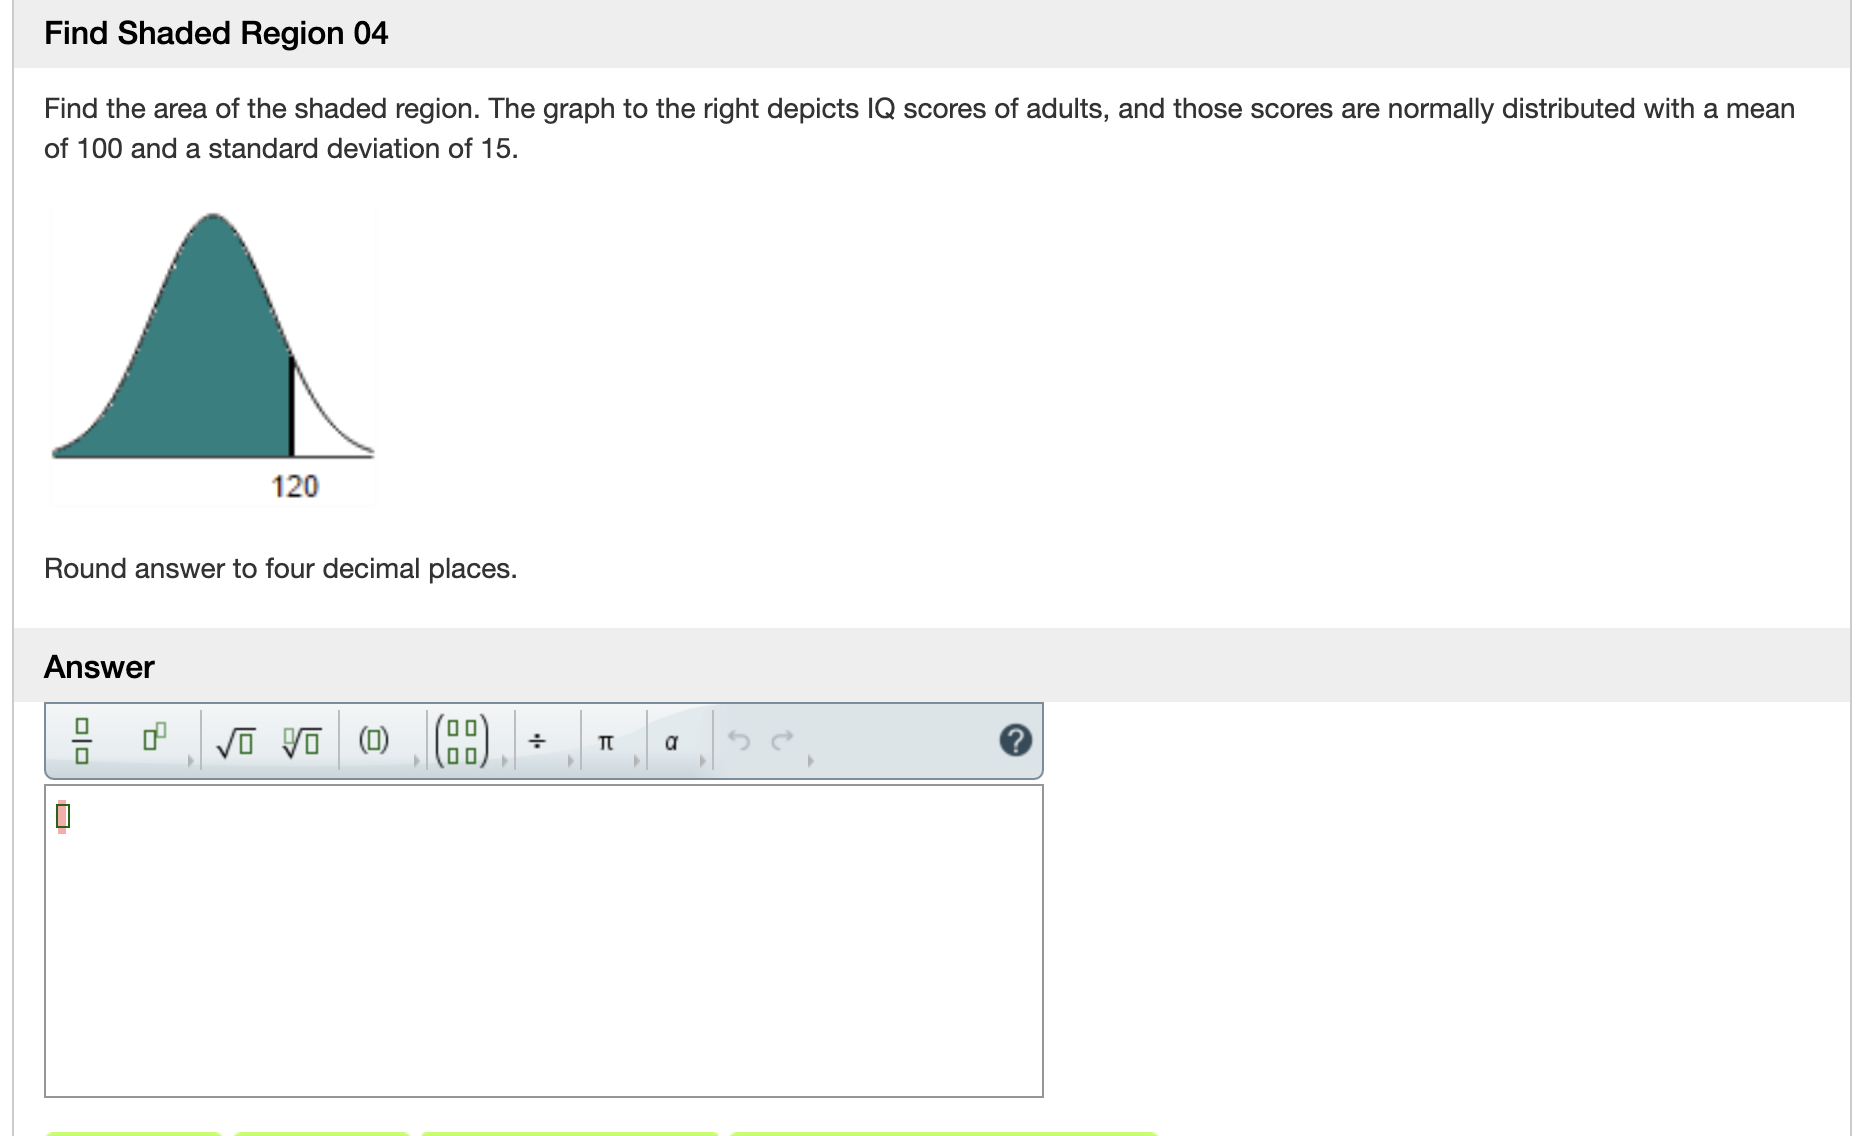

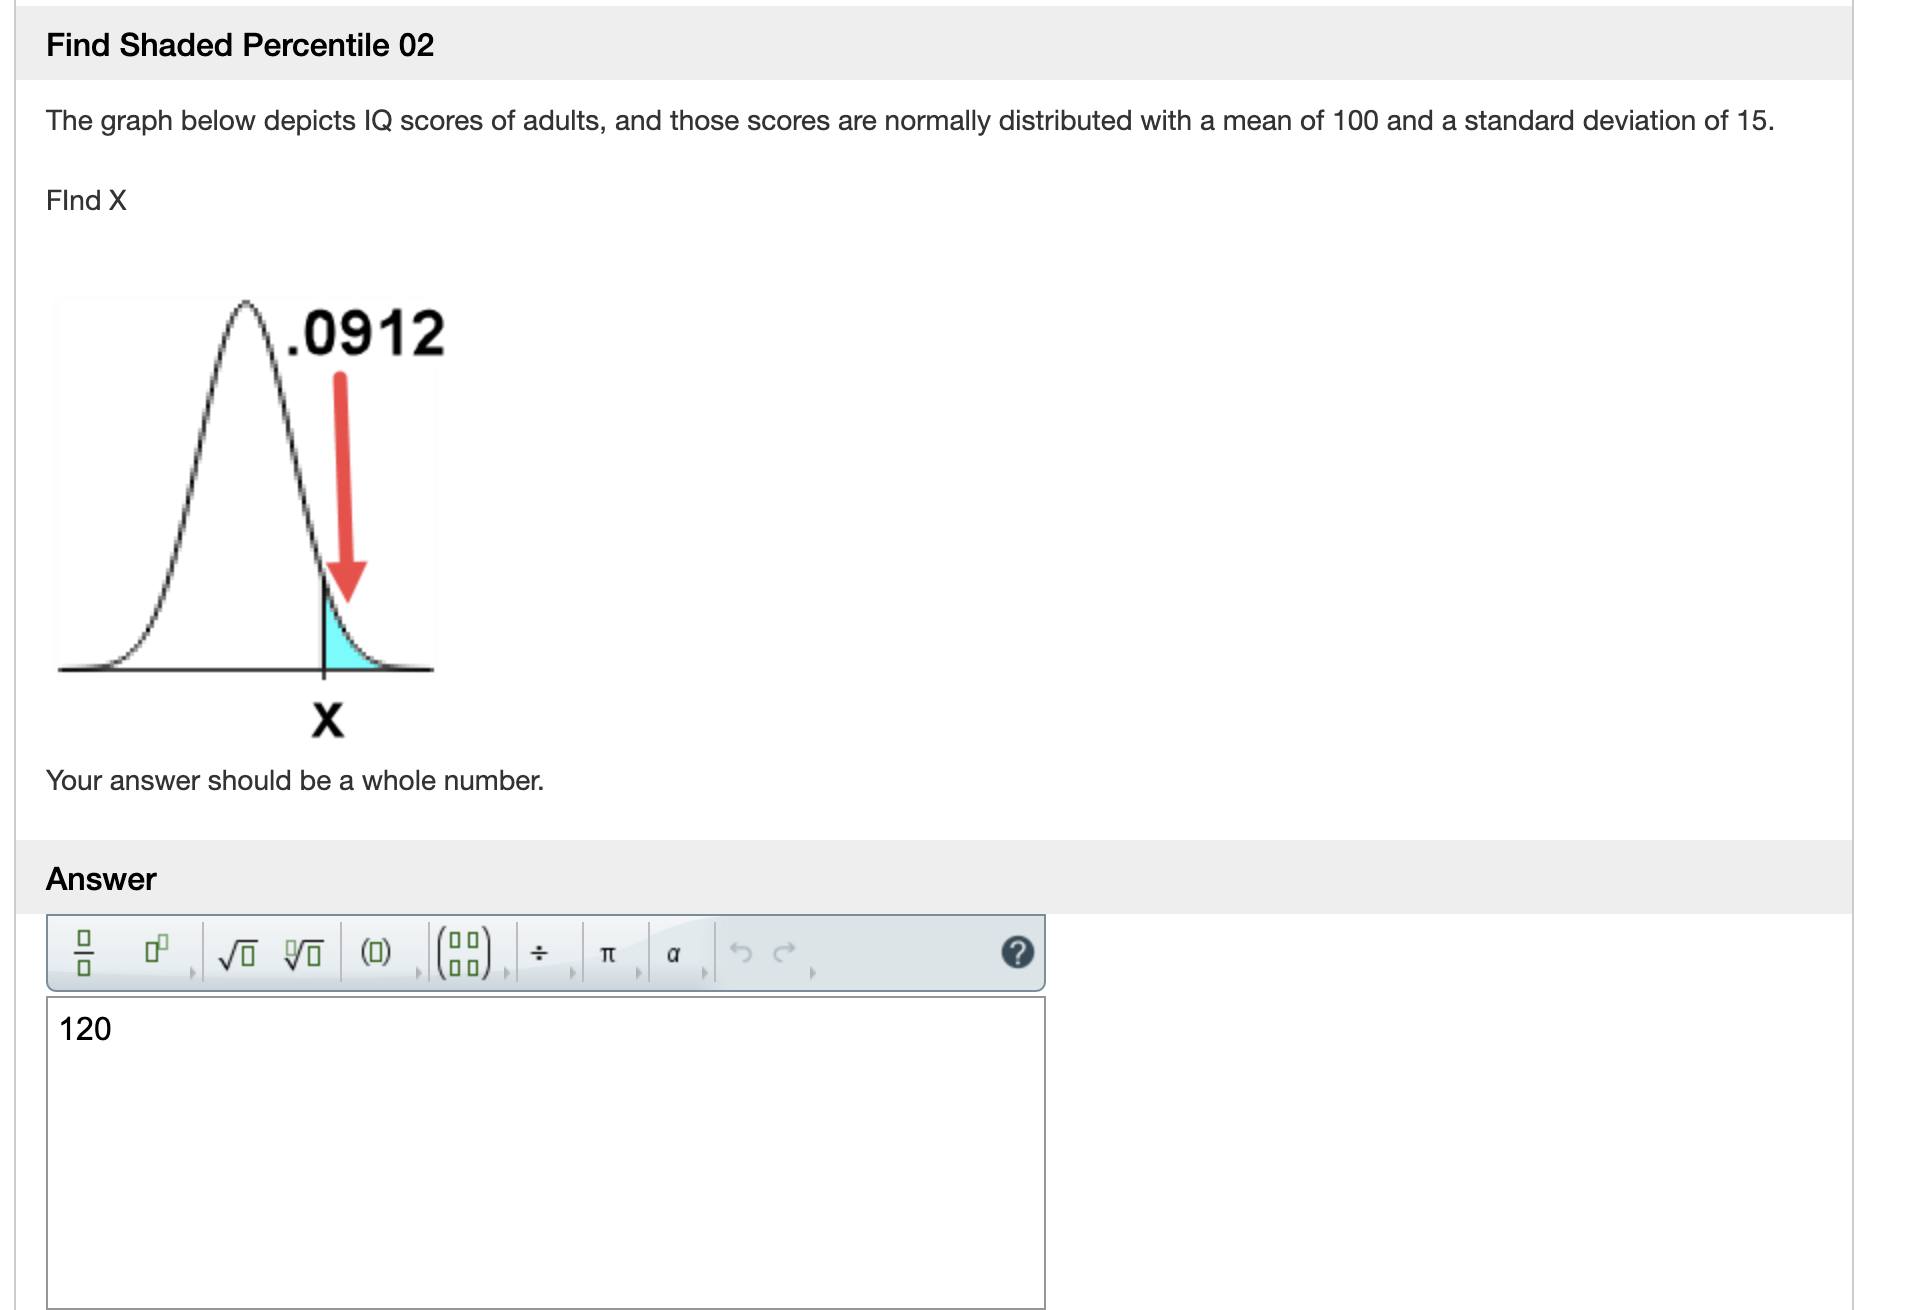
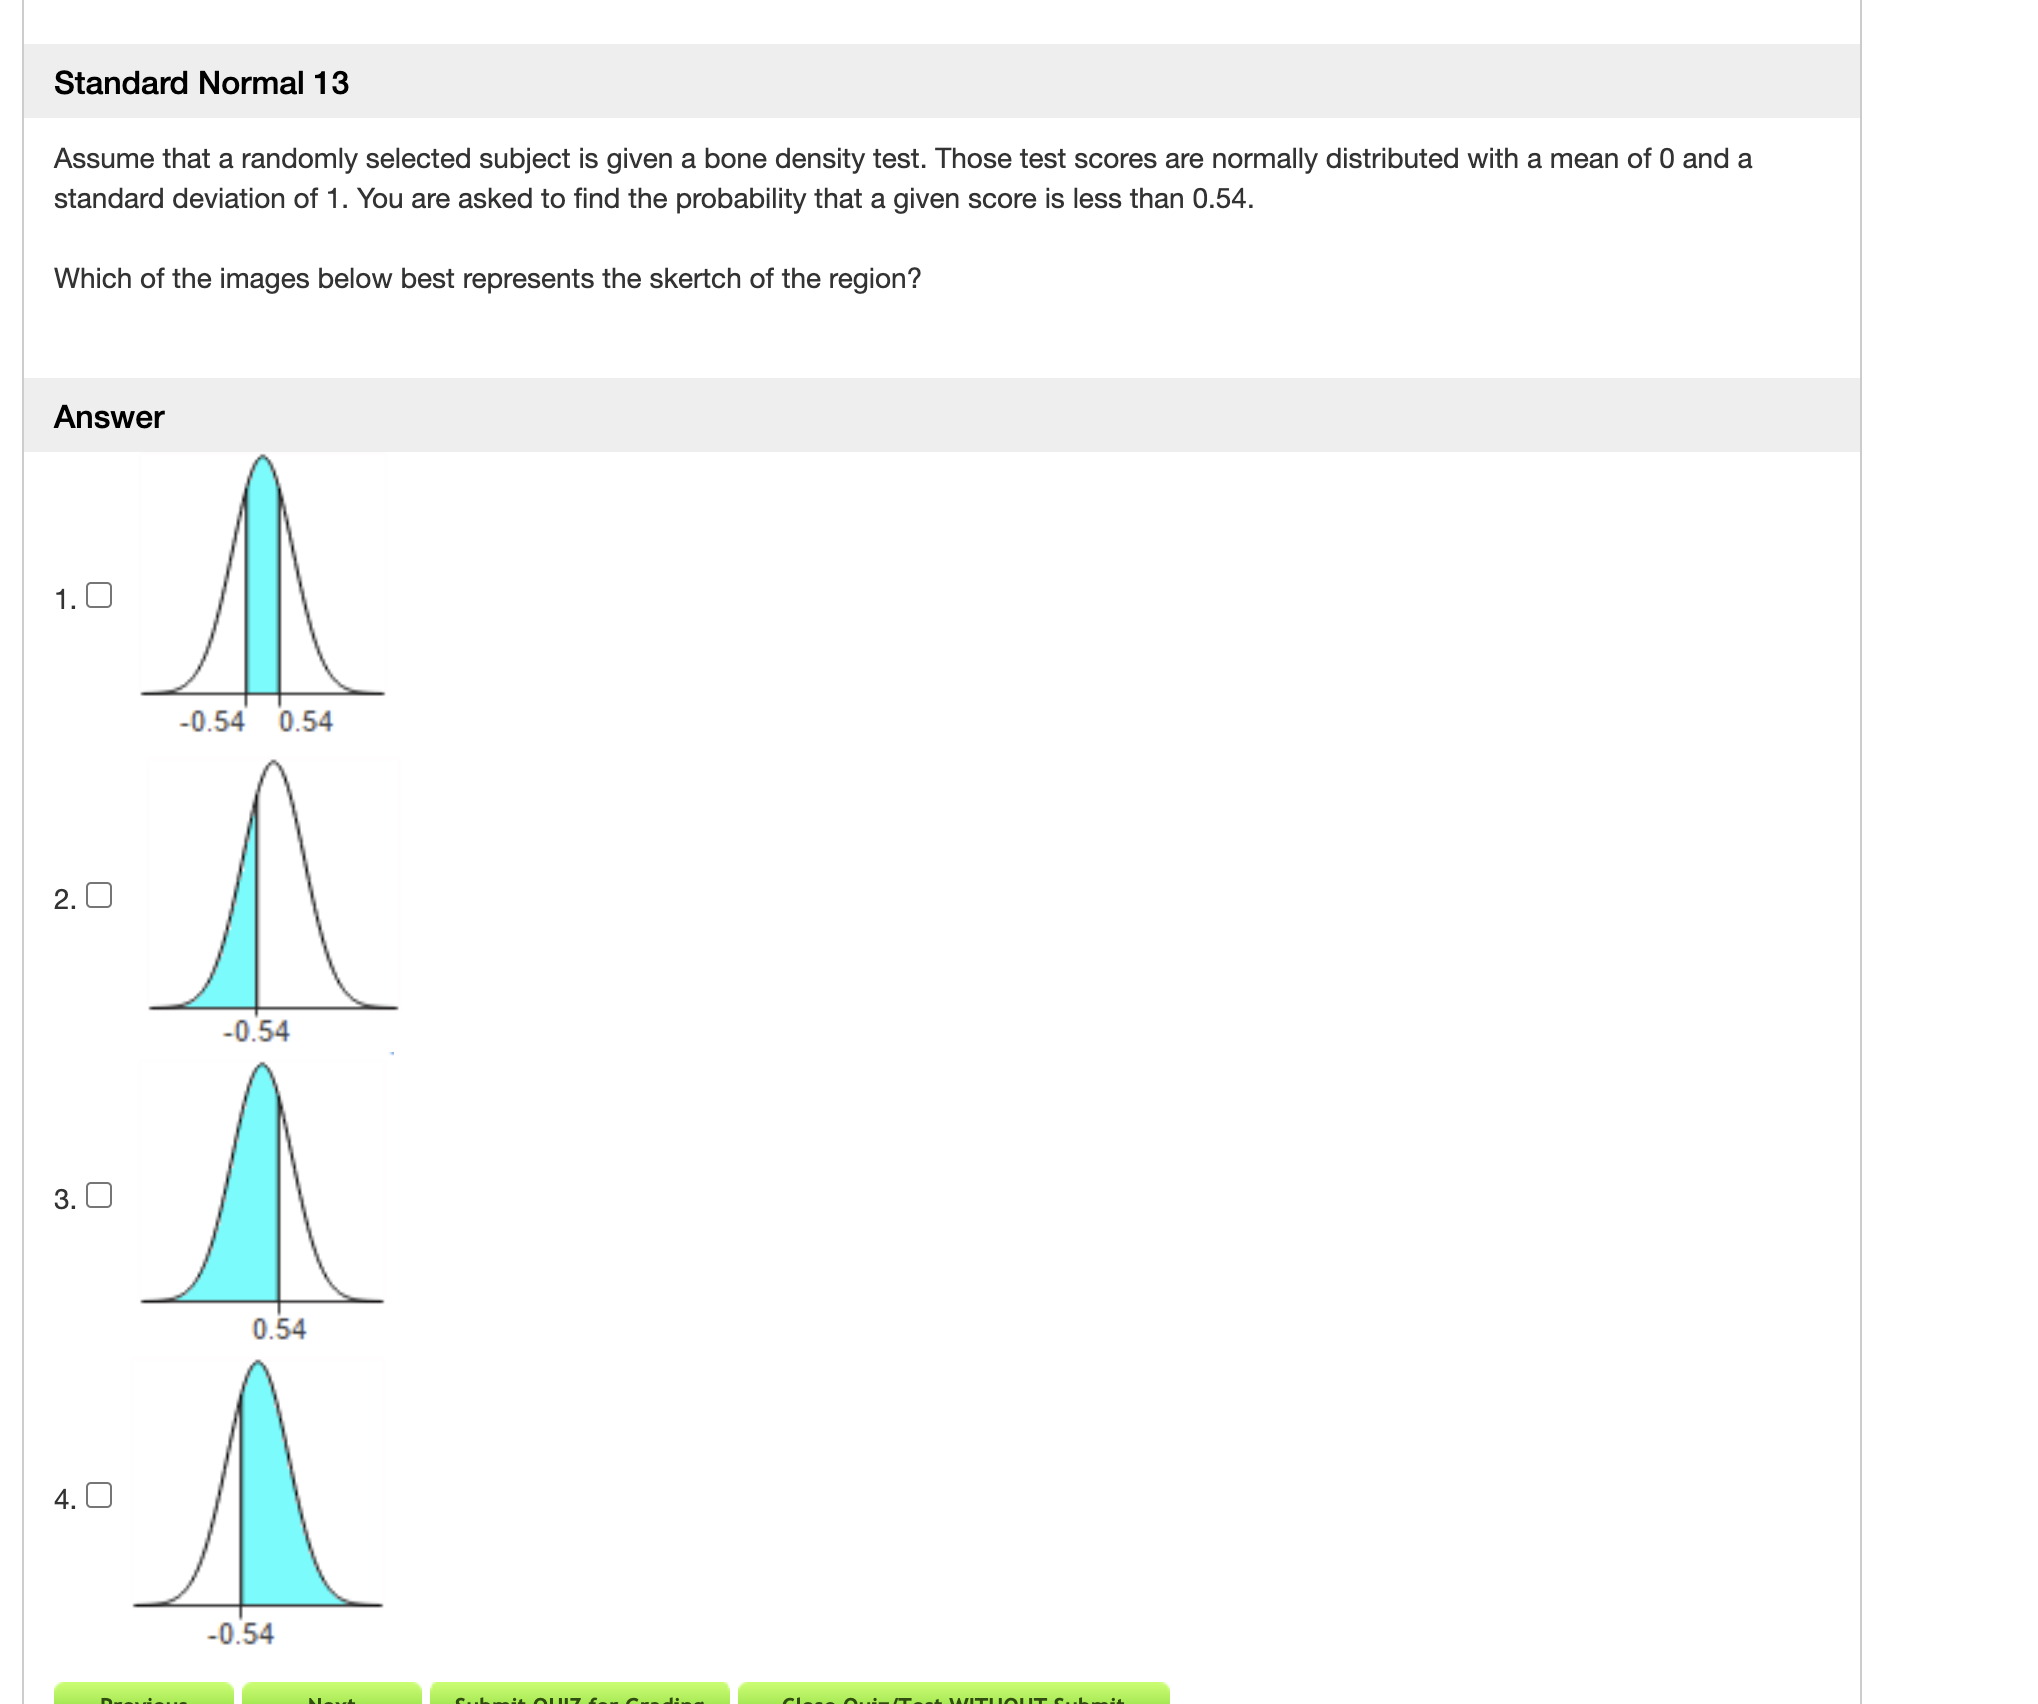
Normal Challenging 03 A math teacher gives two different tests to measure students' aptitude for math. Scores on the first test are normally distributed with a mean of 20 and a standard deviation of 5.3. Scores on the second test are normally distributed with a mean of 69 and a standard deviation of 11.8. Assume that the two tests use different scales to measure the same aptitude. If a student scores 28 on the first test, what would be his equivalent score on the second test? (That is, find the score that would put him in the same percentile.) Your answer should be a whole number. Answer lg n\" ,lJ W| (a) .|(::. I1 +'1'! D **WW Normal Probability 03 The volumes of soda in quart soda bottles are normally distributed with a mean of 32.3 oz and a standard deviation of 1.2 02. What is the probability that the volume of soda in a randomly selected bottle will be less than 32 oz? Your answer should be a decimal rounded to the fourth decimal place. Answer % wlwwlmxllaslla or o D 1! a b D Find Shaded Region 04 Find the area of the shaded region. The graph to the right depicts IQ scores of adults, and those scores are normally distributed with a mean of 100 and a standard deviation of 15. 120 Round answer to four decimal places. Answer Standard Normal 13 Assume that a randomly selected subject is given a bone density test. Those test scores are normally distributed with a mean of 0 and a standard deviation of 1. You are asked to find the probability that a given score is less than 0.54. Which of the images below best represents the skertch of the region? Answer 1. 0 -0.54 0.54 2. 0 -0.54 3. 0 0.54 4. 0 -0.54Find Shaded Percentile 02 The graph below depicts IQ scores of adults, and those scores are normally distributed with a mean of 100 and a standard deviation of 15. Flnd X .0912 L X Your answer should be a whole number. Answer d] D' l , mwlw),|(::,+. 10 all: N
Step by Step Solution
There are 3 Steps involved in it

Get step-by-step solutions from verified subject matter experts