

Question: Answer ALL questions Question 1 PPBG BHD PPBG BHD is a Malaysia-based company engaged in the business of property investment and investment holding. The Company's
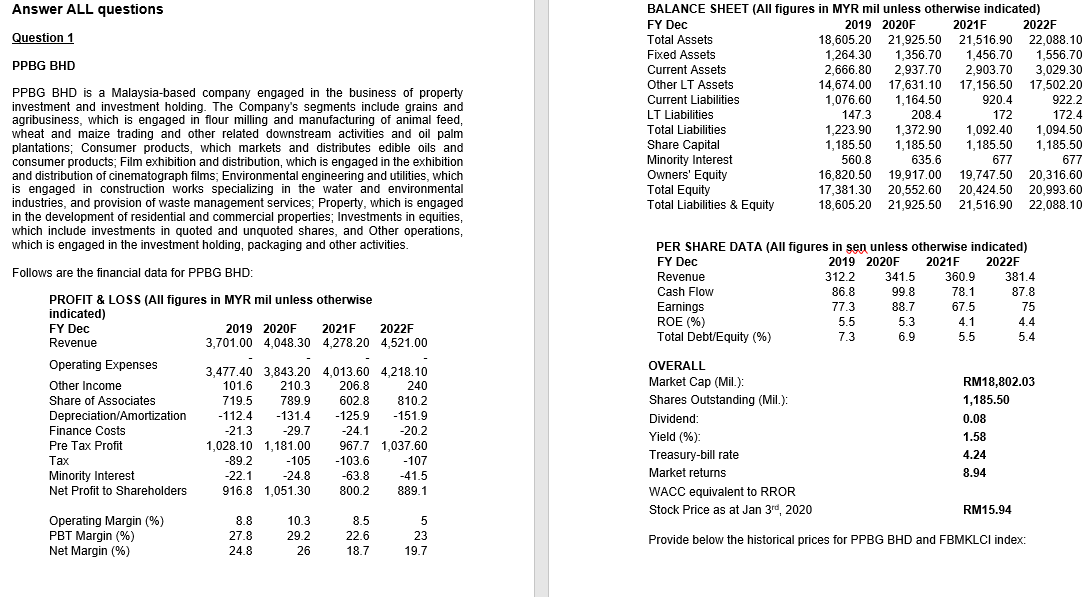
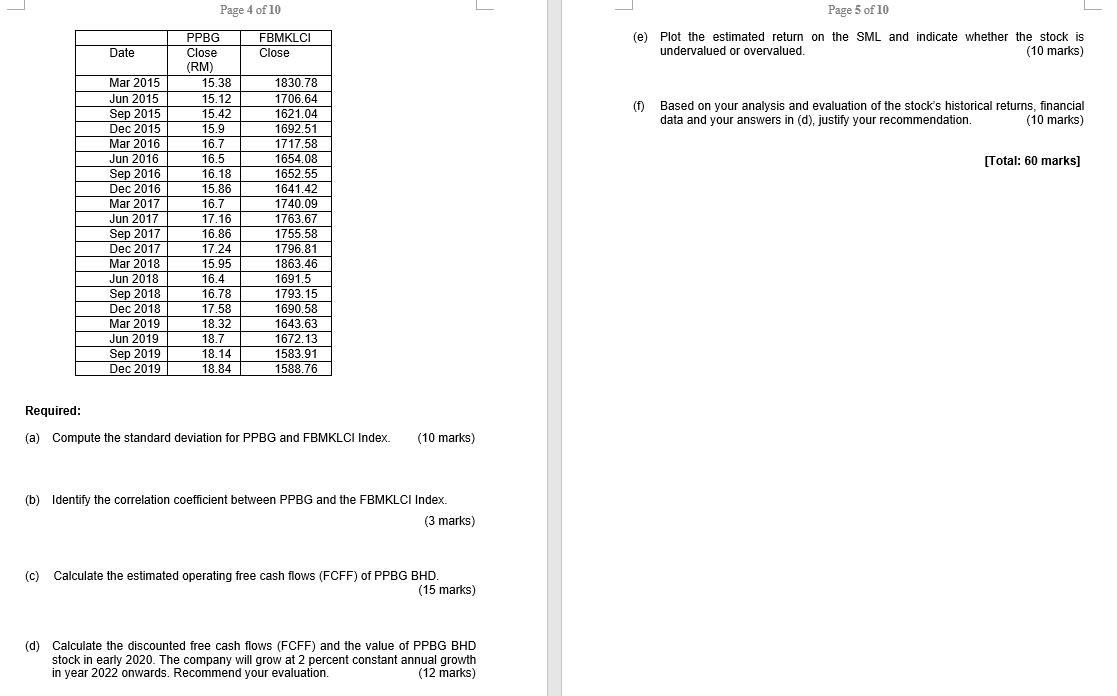
Answer ALL questions Question 1 PPBG BHD PPBG BHD is a Malaysia-based company engaged in the business of property investment and investment holding. The Company's segments include grains and agribusiness, which is engaged in flour milling and manufacturing of animal feed, wheat and maize trading and other related downstream activities and oil palm plantations; Consumer products, which markets and distributes edible oils and consumer products, Film exhibition and distribution, which is engaged in the exhibition and distribution of cinematograph films; Environmental engineering and utilities, which is engaged in construction works specializing in the water and environmental industries, and provision of waste management services; Property, which is engaged in the development of residential and commercial properties; Investments in equities, which include investments in quoted and unquoted shares, and Other operations, which is engaged in the investment holding, packaging and other activities. BALANCE SHEET (All figures in MYR mil unless otherwise indicated) FY Dec 2019 2020F 2021F 2022F Total Assets 18,605.20 21,925.50 21,516.90 22,088.10 Fixed Assets 1,264.30 1,356.70 1,456.70 1,556.70 Current Assets 2,666.80 2,937.70 2,903.70 3,029.30 Other LT Assets 14,674.00 17,631.10 17,156.50 17,502.20 Current Liabilities 1,076.60 1,164.50 920.4 922.2 LT Liabilities 147.3 208.4 172 172.4 Total Liabilities 1,223.90 1,372.90 1,092.40 1,094.50 Share Capital 1,185.50 1,185.50 1,185.50 1,185.50 Minority Interest 560.8 635.6 677 677 Owners' Equity 16,820.50 19,917.00 19,747.50 20,316.60 Total Equity 17,381.30 20,552.60 20,424.50 20,993.60 Total Liabilities & Equity 18,605.20 21,925.50 21,516.90 22,088.10 Follows are the financial data for PPBG BHD: PER SHARE DATA (All figures in sen unless otherwise indicated) FY Dec 2019 2020F 2021F 2022F Revenue 312.2 341.5 360,9 381.4 Cash Flow 86.8 99.8 78.1 87.8 Earnings 77.3 88.7 67.5 75 ROE (%) 5.5 5.3 4.1 4.4 Total Debt/Equity (%) 7.3 6.9 5.5 5.4 PROFIT & LOSS (All figures in MYR mil unless otherwise indicated) FY Dec 2019 2020F 2021F 2022F Revenue 3,701.00 4,048.30 4,278.20 4,521.00 Operating Expenses 3,477.40 3,843.20 4,013.60 4,218.10 Other Income 101.6 210.3 206.8 240 Share of Associates 719.5 789.9 602.8 810.2 Depreciation/Amortization -112.4 -131.4 -125.9 -151.9 Finance Costs -21.3 -29.7 -24.1 -20.2 Pre Tax Profit 1,028.10 1,181.00 967.7 1,037.60 Tax -89.2 -105 -103.6 -107 Minority Interest -22.1 -24.8 -63.8 -41.5 Net Profit to Shareholders 916.8 1,051.30 800.2 889.1 RM18,802.03 1,185.50 0.08 OVERALL Market Cap (Mil.): Shares Outstanding (Mil.): Dividend: Yield (%) Treasury-bill rate Market returns WACC equivalent to RROR Stock Price as at Jan 3rd, 2020 1.58 4.24 8.94 RM15.94 Operating Margin (%) PBT Margin (%) Net Margin (%) 8.8 27.8 24.8 10.3 29.2 26 8.5 22.6 18.7 5 23 19.7 Provide below the historical prices for PPBG BHD and FBMKLCI index: Page 4 of 10 Page 5 of 10 FBMKLCI Close (e) Plot the estimated return on the SML and indicate whether the stock is undervalued or overvalued. (10 marks) Date (1) Based on your analysis and evaluation of the stock's historical returns, financial data and your answers in (d), justify your recommendation. (10 marks) [Total: 60 marks] Mar 2015 Jun 2015 Sep 2015 Dec 2015 Mar 2016 Jun 2016 Sep 2016 Dec 2016 Mar 2017 Jun 2017 Sep 2017 Dec 2017 Mar 2018 Jun 2018 Sep 2018 Dec 2018 Mar 2019 Jun 2019 Sep 2019 Dec 2019 PPBG Close (RM) 15.38 15.12 15.42 15.9 16.7 16.5 16.18 15.86 16.7 17.16 16.86 17.24 15.95 16.4 16.78 17.58 18.32 18.7 18.14 18.84 1830.78 1706.64 1621.04 1692.51 1717.58 1654.08 1652.55 1641.42 1740.09 1763.67 1755.58 1796.81 1863.46 1691.5 1793.15 1690.58 1643.63 1672.13 1583.91 1588.76 Required: (a) Compute the standard deviation for PPBG and FBMKLCI Index. (10 marks) (b) Identify the correlation coefficient between PPBG and the FBMKLCI Index. (3 marks) (c) Calculate the estimated operating free cash flows (FCFF) of PPBG BHD. (15 marks) (d) Calculate the discounted free cash flows (FCFF) and the value of PPBG BHD stock in early 2020. The company will grow at 2 percent constant annual growth in year 2022 onwards. Recommend your evaluation. (12 marks) Answer ALL questions Question 1 PPBG BHD PPBG BHD is a Malaysia-based company engaged in the business of property investment and investment holding. The Company's segments include grains and agribusiness, which is engaged in flour milling and manufacturing of animal feed, wheat and maize trading and other related downstream activities and oil palm plantations; Consumer products, which markets and distributes edible oils and consumer products, Film exhibition and distribution, which is engaged in the exhibition and distribution of cinematograph films; Environmental engineering and utilities, which is engaged in construction works specializing in the water and environmental industries, and provision of waste management services; Property, which is engaged in the development of residential and commercial properties; Investments in equities, which include investments in quoted and unquoted shares, and Other operations, which is engaged in the investment holding, packaging and other activities. BALANCE SHEET (All figures in MYR mil unless otherwise indicated) FY Dec 2019 2020F 2021F 2022F Total Assets 18,605.20 21,925.50 21,516.90 22,088.10 Fixed Assets 1,264.30 1,356.70 1,456.70 1,556.70 Current Assets 2,666.80 2,937.70 2,903.70 3,029.30 Other LT Assets 14,674.00 17,631.10 17,156.50 17,502.20 Current Liabilities 1,076.60 1,164.50 920.4 922.2 LT Liabilities 147.3 208.4 172 172.4 Total Liabilities 1,223.90 1,372.90 1,092.40 1,094.50 Share Capital 1,185.50 1,185.50 1,185.50 1,185.50 Minority Interest 560.8 635.6 677 677 Owners' Equity 16,820.50 19,917.00 19,747.50 20,316.60 Total Equity 17,381.30 20,552.60 20,424.50 20,993.60 Total Liabilities & Equity 18,605.20 21,925.50 21,516.90 22,088.10 Follows are the financial data for PPBG BHD: PER SHARE DATA (All figures in sen unless otherwise indicated) FY Dec 2019 2020F 2021F 2022F Revenue 312.2 341.5 360,9 381.4 Cash Flow 86.8 99.8 78.1 87.8 Earnings 77.3 88.7 67.5 75 ROE (%) 5.5 5.3 4.1 4.4 Total Debt/Equity (%) 7.3 6.9 5.5 5.4 PROFIT & LOSS (All figures in MYR mil unless otherwise indicated) FY Dec 2019 2020F 2021F 2022F Revenue 3,701.00 4,048.30 4,278.20 4,521.00 Operating Expenses 3,477.40 3,843.20 4,013.60 4,218.10 Other Income 101.6 210.3 206.8 240 Share of Associates 719.5 789.9 602.8 810.2 Depreciation/Amortization -112.4 -131.4 -125.9 -151.9 Finance Costs -21.3 -29.7 -24.1 -20.2 Pre Tax Profit 1,028.10 1,181.00 967.7 1,037.60 Tax -89.2 -105 -103.6 -107 Minority Interest -22.1 -24.8 -63.8 -41.5 Net Profit to Shareholders 916.8 1,051.30 800.2 889.1 RM18,802.03 1,185.50 0.08 OVERALL Market Cap (Mil.): Shares Outstanding (Mil.): Dividend: Yield (%) Treasury-bill rate Market returns WACC equivalent to RROR Stock Price as at Jan 3rd, 2020 1.58 4.24 8.94 RM15.94 Operating Margin (%) PBT Margin (%) Net Margin (%) 8.8 27.8 24.8 10.3 29.2 26 8.5 22.6 18.7 5 23 19.7 Provide below the historical prices for PPBG BHD and FBMKLCI index: Page 4 of 10 Page 5 of 10 FBMKLCI Close (e) Plot the estimated return on the SML and indicate whether the stock is undervalued or overvalued. (10 marks) Date (1) Based on your analysis and evaluation of the stock's historical returns, financial data and your answers in (d), justify your recommendation. (10 marks) [Total: 60 marks] Mar 2015 Jun 2015 Sep 2015 Dec 2015 Mar 2016 Jun 2016 Sep 2016 Dec 2016 Mar 2017 Jun 2017 Sep 2017 Dec 2017 Mar 2018 Jun 2018 Sep 2018 Dec 2018 Mar 2019 Jun 2019 Sep 2019 Dec 2019 PPBG Close (RM) 15.38 15.12 15.42 15.9 16.7 16.5 16.18 15.86 16.7 17.16 16.86 17.24 15.95 16.4 16.78 17.58 18.32 18.7 18.14 18.84 1830.78 1706.64 1621.04 1692.51 1717.58 1654.08 1652.55 1641.42 1740.09 1763.67 1755.58 1796.81 1863.46 1691.5 1793.15 1690.58 1643.63 1672.13 1583.91 1588.76 Required: (a) Compute the standard deviation for PPBG and FBMKLCI Index. (10 marks) (b) Identify the correlation coefficient between PPBG and the FBMKLCI Index. (3 marks) (c) Calculate the estimated operating free cash flows (FCFF) of PPBG BHD. (15 marks) (d) Calculate the discounted free cash flows (FCFF) and the value of PPBG BHD stock in early 2020. The company will grow at 2 percent constant annual growth in year 2022 onwards. Recommend your evaluation. (12 marks)
Step by Step Solution
There are 3 Steps involved in it

Get step-by-step solutions from verified subject matter experts