

Question: Answer all section of question 1&2 using the attached excel spreadsheet. Show all answers on this sheet and your work on paper or on excel
Answer all section of question 1&2 using the attached excel spreadsheet. Show all answers on this sheet and your work on paper or on excel file uploaded to Canvas. Calculate the following:

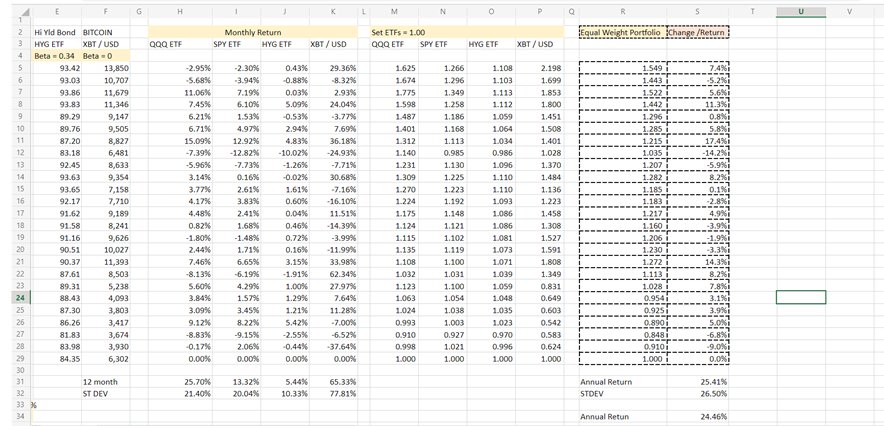
a) Based on two years of historic data provided by Bloomberg, calculate expected annual return, annual standard deviation and Sharpe ratio for each of the four exchange-traded funds (ETFs) portfolios (QQQ Nasdaq 100, SPY S&P 500, HYG iBoxx High Yield Bond, XBT -- Bitcoin). Hint: build up from monthly returns to annual.
b) Calculate the beta, expected annual return, annual standard deviation and Sharpe ratio for an equally weighted portfolio ( QQQ, SPY, HYG, XBT).
c) Do any of the portfolios lie on the security market line? If not are they above or below the line? Correctly draw SML with ETFs for extra points.
d) Construct a portfolio with an expected return consistent with the equity market using iBoxx High Yield ETF (HYG) and US Treasury 10-year bond. Assume you can invest and borrow at the risk-free rate.
e) Explain the difference between the Beta and standard deviation on the equally weighted portfolio.
f) How would you calculate unsystemic risk given the information above?
E F G H K L M N O T U V Monthly Return SPY ETF HYG ETF Equal Weight Portfolio Change/Return Set ETFs - 1.00 QQQ ETF SPY ETF QQQ ETF XET / U50 HYG ETF XT / USD 0.43% 1.625 1.674 1.775 1.598 1.549 1.443 7.4% -5.2% 5.6 1.487 1.401 1.312 1.140 1.231 1.309 1.296 1.285 1.215 1.035 1.207 1.282 1.185 -14 2 Hi Yld Bond BITCOIN 3 HYG ETF XET / USD 4 Beta -0.34 Beta 5 93.42 13,850 6 93.03 10,707 7 93.86 11,679 8 93.83 11,346 9 89.29 9,147 10 89.76 9,505 11 87.20 8,827 12 83.18 6,481 13 92.45 8,633 14 93.63 9,354 15 93.65 7.158 16 92.17 7,710 17 91.62 9.189 18 91.58 8,241 19 91.16 9,626 20 90.51 10,027 21 90.37 11,393 22 87.61 8,503 23 89.31 5.238 24 88.43 4,093 25 87.30 3,803 26 86.26 3,417 27 81.83 3,674 28 83.98 3,930 29 84.35 6,302 30 31 12 month 32 ST DEV 33 % 34 -2.95% -5.68% 11.06% 7.45% 6.21% 6.71% 15.09% -7.39% -5.96% 3.14% 3.77% 4.17% 4.48% 0.82% -1.80% 2.44% 7.46% -8.13% 5.60% 3.84% 3.09% 9.12% -8.83% -0.17% 0.00% -2.30% -3.94% 7.19% 6.10% 1.53% 4.97% 12.92% -12.82% -7.73% 0.16% 2.61% 3.83% 2.41% 1.68% -1.48% 1.71% 6,65% -6.19% 4.29% 1.57% 3.45% 8.22% -9.15% -0.88% 0.03% 5.09% -0.53% 2.94% 4.83% -10.02% -1.26% -0.02% 1.61% 0.60% 0.04% 0.46% 0.72% 0.16% 3.15% -1.91% 1.00% 1.29% 1.2156 29.36% 8.32% 2.93% 24.04% -3.77% 7.69% 36.18% -24.93% -7.71% 30.68% -7.16% -16.10% 11.51% -14.39% -3.99% -11.99% 33.98% 62.34% 27.97% 7.64% 11.28% -7.00% -6.52% -37.64% 0.00% 1.266 1.296 1.349 1.258 1.186 1.168 1.113 0.985 1.130 1.225 1.223 1.192 1.148 1.121 1.102 1.119 1.100 1.031 1.100 1.054 1.038 1.003 0.927 1.021 1.000 1.270 1.224 1.175 1.124 1.115 1.135 1.108 1.032 1.123 1.063 1.024 0.993 0.910 0.998 1.000 1.108 1.103 1.113 1.112 1.059 1.064 1.034 0.986 1.096 1.110 1.110 1.093 1.086 1.086 1.081 1.073 1.071 1.039 1.059 1.048 1.035 1.023 0.970 0.996 1.000 2.198 1.699 1.853 1.800 1.451 1.508 1.401 1.028 1.370 1.484 1.136 1.223 1.458 1,308 1.527 1.591 1.808 1.349 0.831 0.649 0.603 0.542 0.583 0.624 1.000 -1.9% 1.217 1.160 1.206 i 1.230 1.272 i 1.113 i 1.028 0.9541 0.925 0.890 i 0.848 0.9101 1.000 5.42% 2.06% -2.55% -0.44% 0.00% -9.01 0.0% 0.00% 25.70% 21.40% 13.32% 20.04% 5.44% 10.33% 65.33% 77.81% Annual Return STDEV 25.41% 26.50% Annual Retun 24.46% QQQ SPY HYG XBT US-Treasury Equity Risk Premium Expected Market Return Beta 1.08 1.01 0.34 0.0 0.0 1.0 1.0 Expected Return = R ?? ?? ?? ?? 0.8% 5.2% 6.0% E F G H K L M N O T U V Monthly Return SPY ETF HYG ETF Equal Weight Portfolio Change/Return Set ETFs - 1.00 QQQ ETF SPY ETF QQQ ETF XET / U50 HYG ETF XT / USD 0.43% 1.625 1.674 1.775 1.598 1.549 1.443 7.4% -5.2% 5.6 1.487 1.401 1.312 1.140 1.231 1.309 1.296 1.285 1.215 1.035 1.207 1.282 1.185 -14 2 Hi Yld Bond BITCOIN 3 HYG ETF XET / USD 4 Beta -0.34 Beta 5 93.42 13,850 6 93.03 10,707 7 93.86 11,679 8 93.83 11,346 9 89.29 9,147 10 89.76 9,505 11 87.20 8,827 12 83.18 6,481 13 92.45 8,633 14 93.63 9,354 15 93.65 7.158 16 92.17 7,710 17 91.62 9.189 18 91.58 8,241 19 91.16 9,626 20 90.51 10,027 21 90.37 11,393 22 87.61 8,503 23 89.31 5.238 24 88.43 4,093 25 87.30 3,803 26 86.26 3,417 27 81.83 3,674 28 83.98 3,930 29 84.35 6,302 30 31 12 month 32 ST DEV 33 % 34 -2.95% -5.68% 11.06% 7.45% 6.21% 6.71% 15.09% -7.39% -5.96% 3.14% 3.77% 4.17% 4.48% 0.82% -1.80% 2.44% 7.46% -8.13% 5.60% 3.84% 3.09% 9.12% -8.83% -0.17% 0.00% -2.30% -3.94% 7.19% 6.10% 1.53% 4.97% 12.92% -12.82% -7.73% 0.16% 2.61% 3.83% 2.41% 1.68% -1.48% 1.71% 6,65% -6.19% 4.29% 1.57% 3.45% 8.22% -9.15% -0.88% 0.03% 5.09% -0.53% 2.94% 4.83% -10.02% -1.26% -0.02% 1.61% 0.60% 0.04% 0.46% 0.72% 0.16% 3.15% -1.91% 1.00% 1.29% 1.2156 29.36% 8.32% 2.93% 24.04% -3.77% 7.69% 36.18% -24.93% -7.71% 30.68% -7.16% -16.10% 11.51% -14.39% -3.99% -11.99% 33.98% 62.34% 27.97% 7.64% 11.28% -7.00% -6.52% -37.64% 0.00% 1.266 1.296 1.349 1.258 1.186 1.168 1.113 0.985 1.130 1.225 1.223 1.192 1.148 1.121 1.102 1.119 1.100 1.031 1.100 1.054 1.038 1.003 0.927 1.021 1.000 1.270 1.224 1.175 1.124 1.115 1.135 1.108 1.032 1.123 1.063 1.024 0.993 0.910 0.998 1.000 1.108 1.103 1.113 1.112 1.059 1.064 1.034 0.986 1.096 1.110 1.110 1.093 1.086 1.086 1.081 1.073 1.071 1.039 1.059 1.048 1.035 1.023 0.970 0.996 1.000 2.198 1.699 1.853 1.800 1.451 1.508 1.401 1.028 1.370 1.484 1.136 1.223 1.458 1,308 1.527 1.591 1.808 1.349 0.831 0.649 0.603 0.542 0.583 0.624 1.000 -1.9% 1.217 1.160 1.206 i 1.230 1.272 i 1.113 i 1.028 0.9541 0.925 0.890 i 0.848 0.9101 1.000 5.42% 2.06% -2.55% -0.44% 0.00% -9.01 0.0% 0.00% 25.70% 21.40% 13.32% 20.04% 5.44% 10.33% 65.33% 77.81% Annual Return STDEV 25.41% 26.50% Annual Retun 24.46% QQQ SPY HYG XBT US-Treasury Equity Risk Premium Expected Market Return Beta 1.08 1.01 0.34 0.0 0.0 1.0 1.0 Expected Return = R ?? ?? ?? ?? 0.8% 5.2% 6.0%
Step by Step Solution
There are 3 Steps involved in it

Get step-by-step solutions from verified subject matter experts