

Question: answer all simple questions 12 An organization using control charts employs, 4 independent decision rules to the observations (or their patterns) on the control chart
answer all simple questions
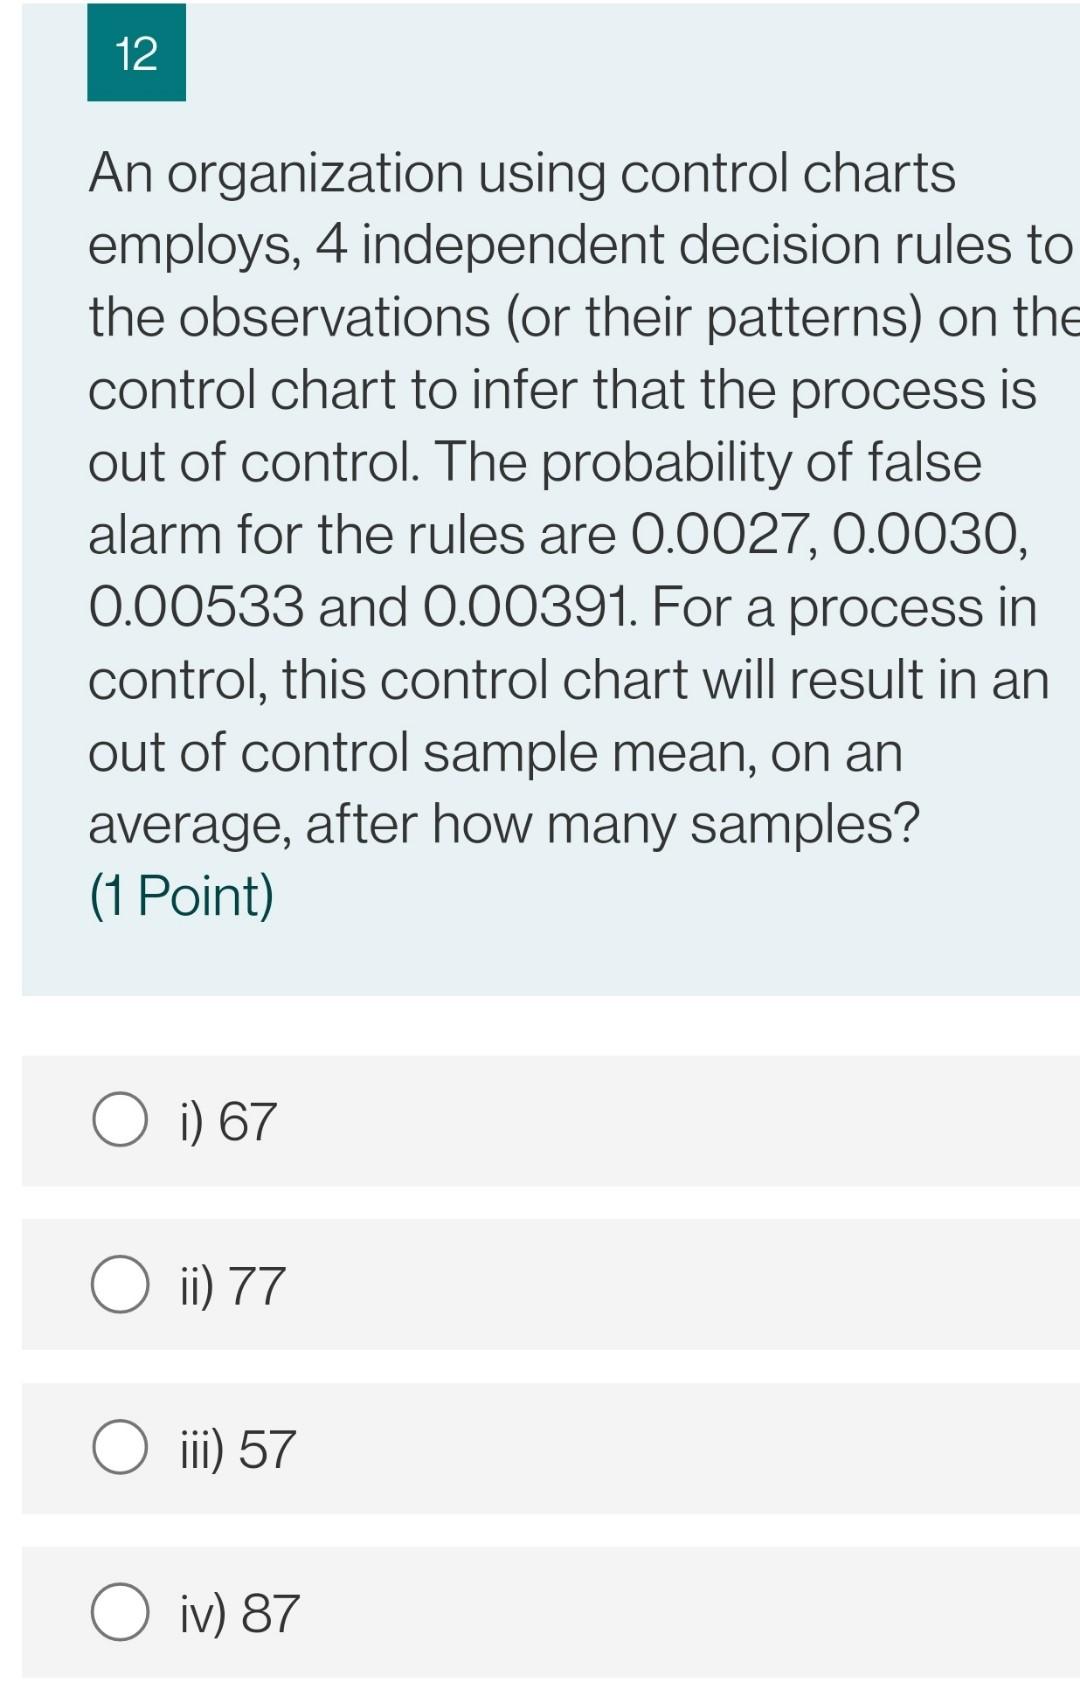
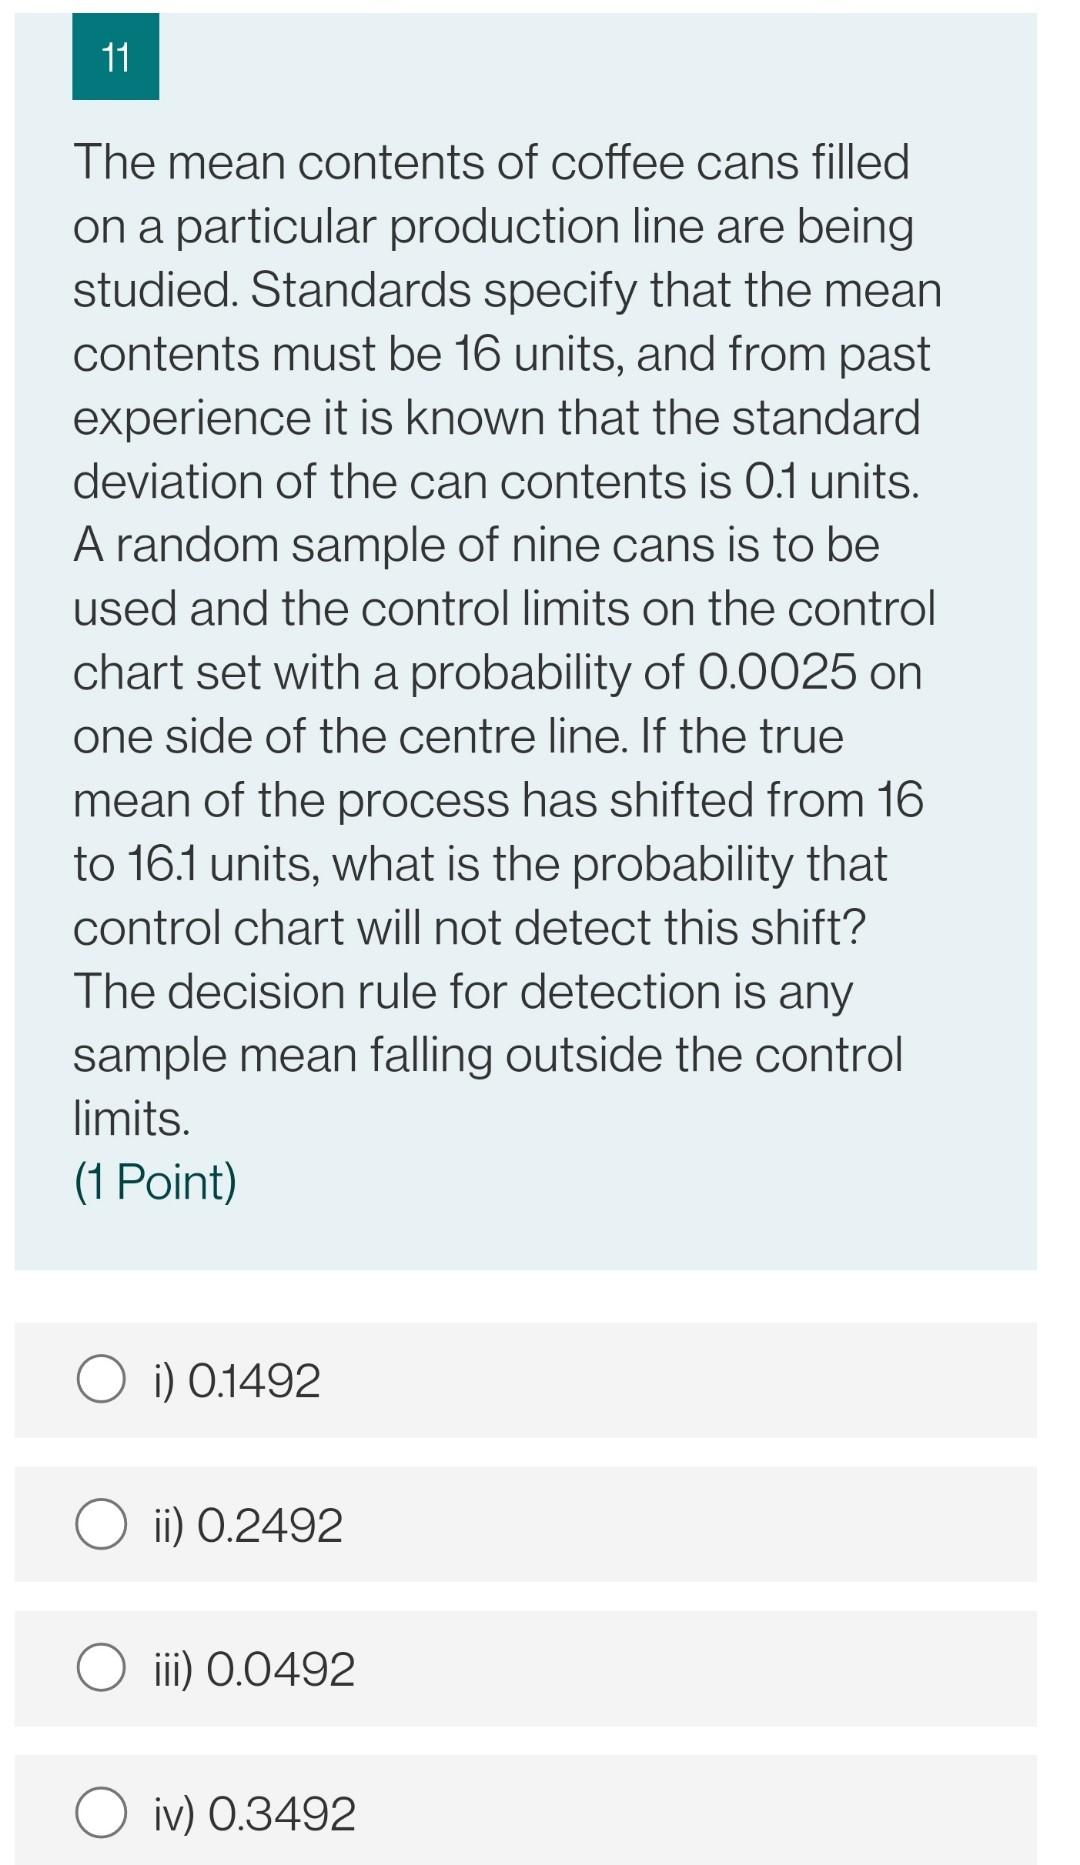
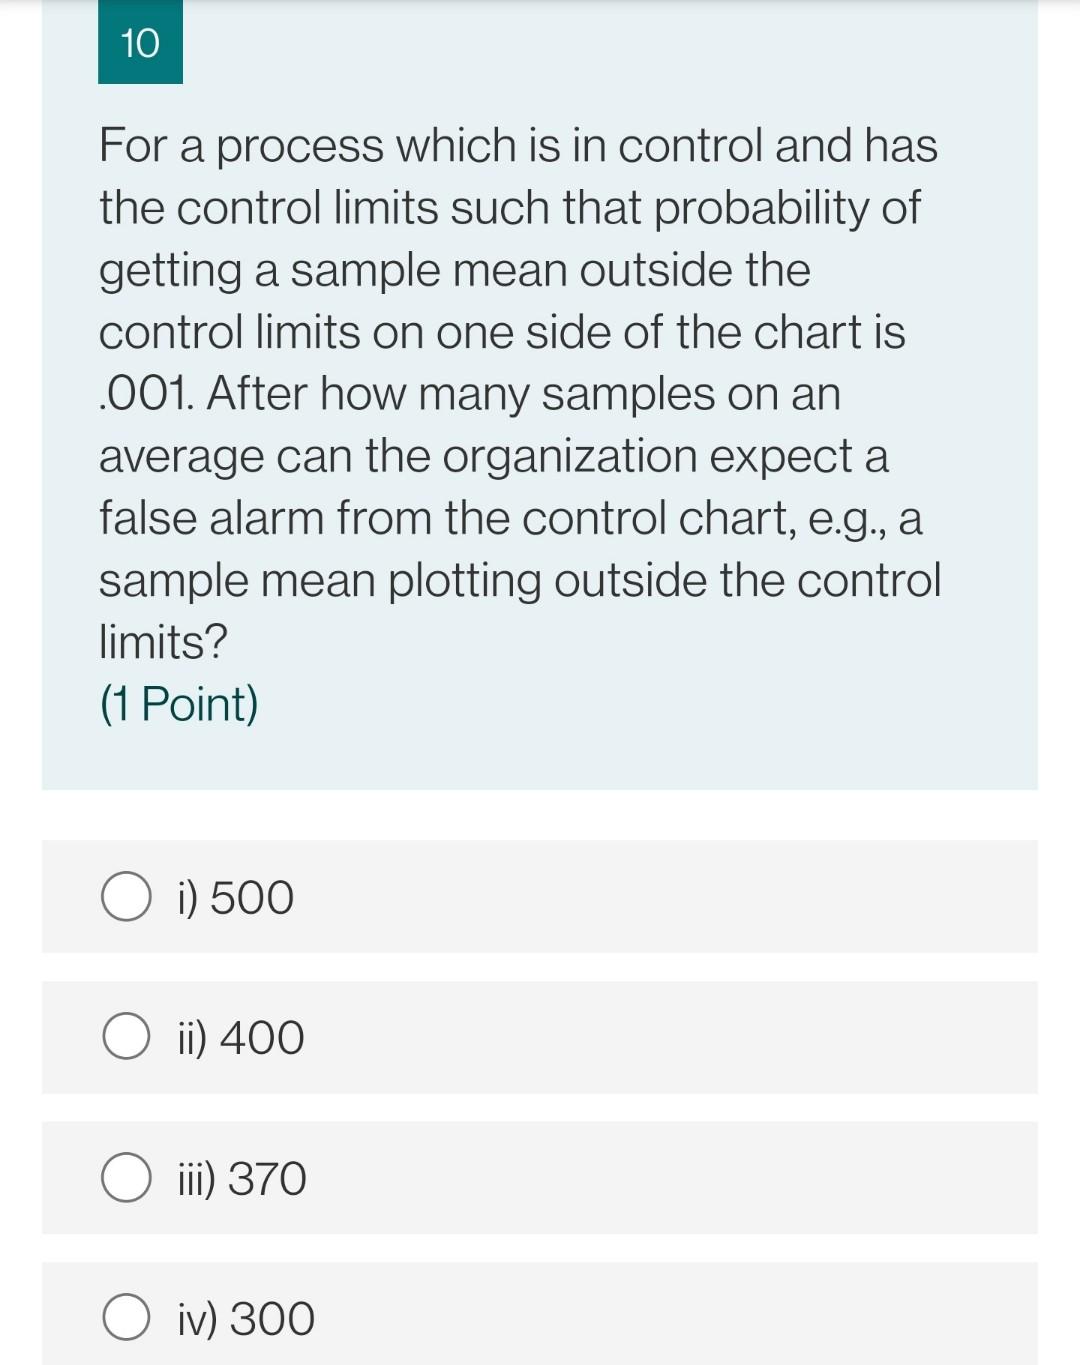
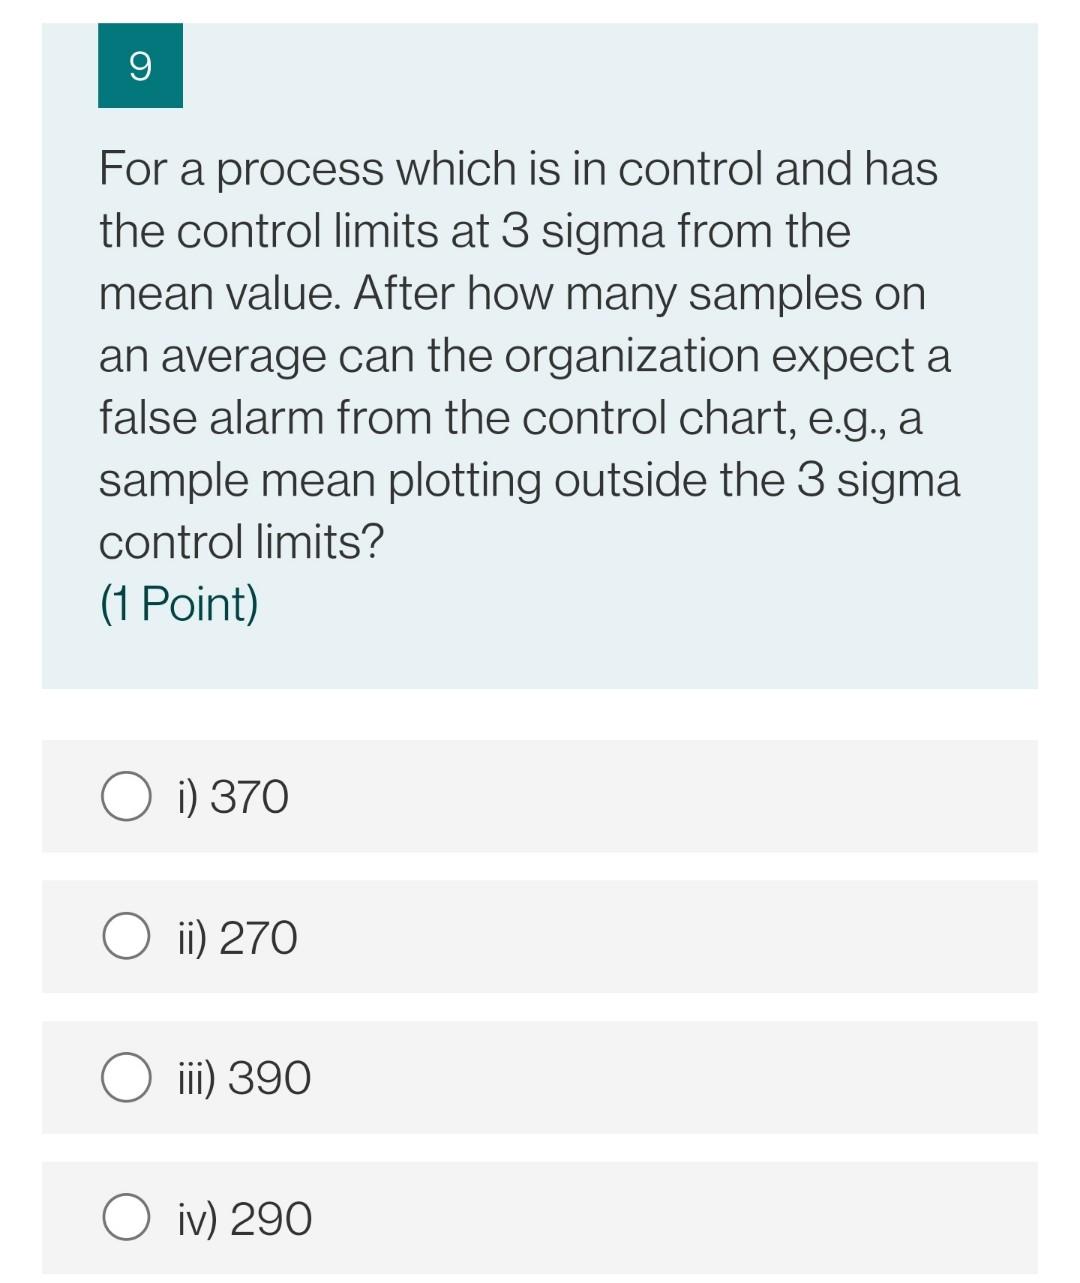
12 An organization using control charts employs, 4 independent decision rules to the observations (or their patterns) on the control chart to infer that the process is out of control. The probability of false alarm for the rules are 0.0027, 0.0030, 0.00533 and 0.00391. For a process in control, this control chart will result in an out of control sample mean, on an average, after how many samples? (1 Point) O i) 67 O ii) 77 O iii) 57 O iv) 87 11 The mean contents of coffee cans filled on a particular production line are being studied. Standards specify that the mean contents must be 16 units, and from past experience it is known that the standard deviation of the can contents is 0.1 units. A random sample of nine cans is to be used and the control limits on the control chart set with a probability of 0.0025 on one side of the centre line. If the true mean of the process has shifted from 16 to 16.1 units, what is the probability that control chart will not detect this shift? The decision rule for detection is any sample mean falling outside the control limits. (1 Point) O i) 0.1492 O ii) 0.2492 ) iii) 0.0492 O iv) 0.3492 10 For a process which is in control and has the control limits such that probability of getting a sample mean outside the control limits on one side of the chart is .001. After how many samples on an average can the organization expect a false alarm from the control chart, e.g., a sample mean plotting outside the control limits? (1 Point) i) 500 O ii) 400 iii) 370 O iv) 300 9 For a process which is in control and has the control limits at 3 sigma from the mean value. After how many samples on an average can the organization expect a false alarm from the control chart, e.g., a sample mean plotting outside the 3 sigma control limits? (1 Point) i) 370 ii) 270 iii) 390 O iv) 290 12 An organization using control charts employs, 4 independent decision rules to the observations (or their patterns) on the control chart to infer that the process is out of control. The probability of false alarm for the rules are 0.0027, 0.0030, 0.00533 and 0.00391. For a process in control, this control chart will result in an out of control sample mean, on an average, after how many samples? (1 Point) O i) 67 O ii) 77 O iii) 57 O iv) 87 11 The mean contents of coffee cans filled on a particular production line are being studied. Standards specify that the mean contents must be 16 units, and from past experience it is known that the standard deviation of the can contents is 0.1 units. A random sample of nine cans is to be used and the control limits on the control chart set with a probability of 0.0025 on one side of the centre line. If the true mean of the process has shifted from 16 to 16.1 units, what is the probability that control chart will not detect this shift? The decision rule for detection is any sample mean falling outside the control limits. (1 Point) O i) 0.1492 O ii) 0.2492 ) iii) 0.0492 O iv) 0.3492 10 For a process which is in control and has the control limits such that probability of getting a sample mean outside the control limits on one side of the chart is .001. After how many samples on an average can the organization expect a false alarm from the control chart, e.g., a sample mean plotting outside the control limits? (1 Point) i) 500 O ii) 400 iii) 370 O iv) 300 9 For a process which is in control and has the control limits at 3 sigma from the mean value. After how many samples on an average can the organization expect a false alarm from the control chart, e.g., a sample mean plotting outside the 3 sigma control limits? (1 Point) i) 370 ii) 270 iii) 390 O iv) 290Step by Step Solution
There are 3 Steps involved in it
1 Expert Approved Answer
Step: 1 Unlock

Question Has Been Solved by an Expert!
Get step-by-step solutions from verified subject matter experts
Step: 2 Unlock
Step: 3 Unlock