

Question: Answer all three parts correct. Use the Break-Even Analysis table below, find the values of Cumulative Costs for Year 1 to 6. Break-Even Analysis Table:
Answer all three parts correct.
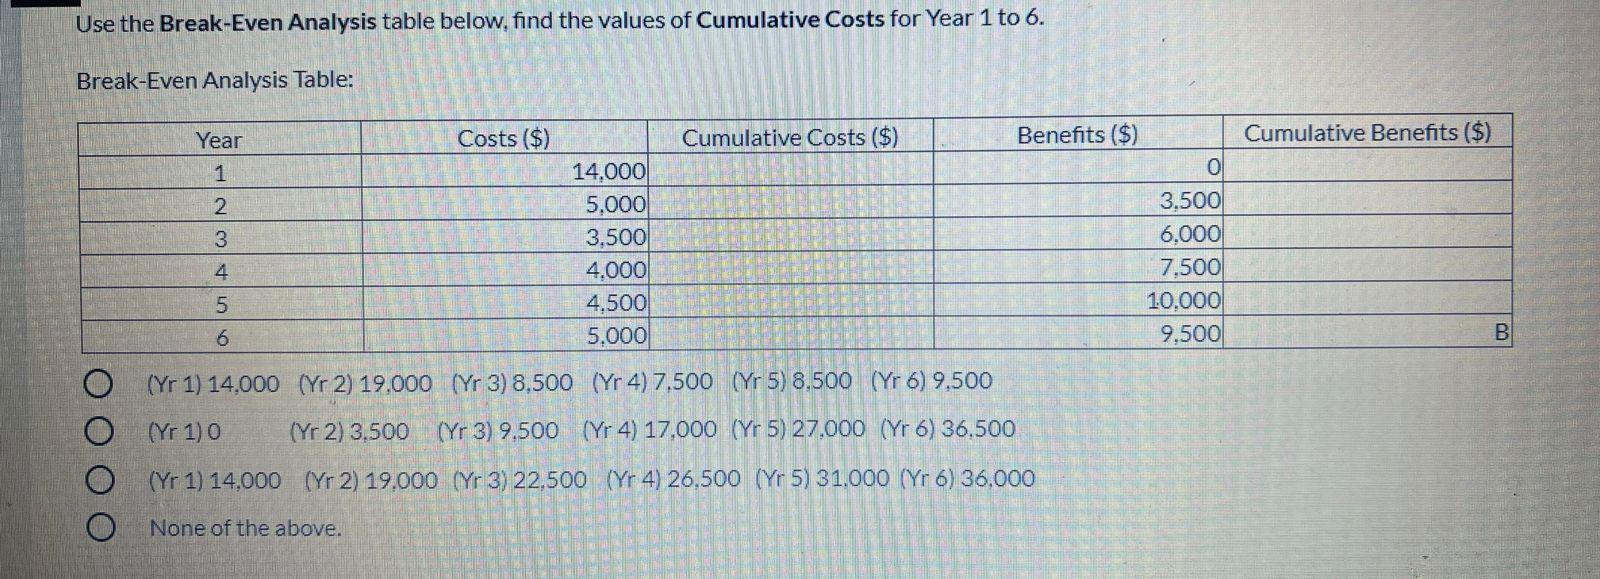
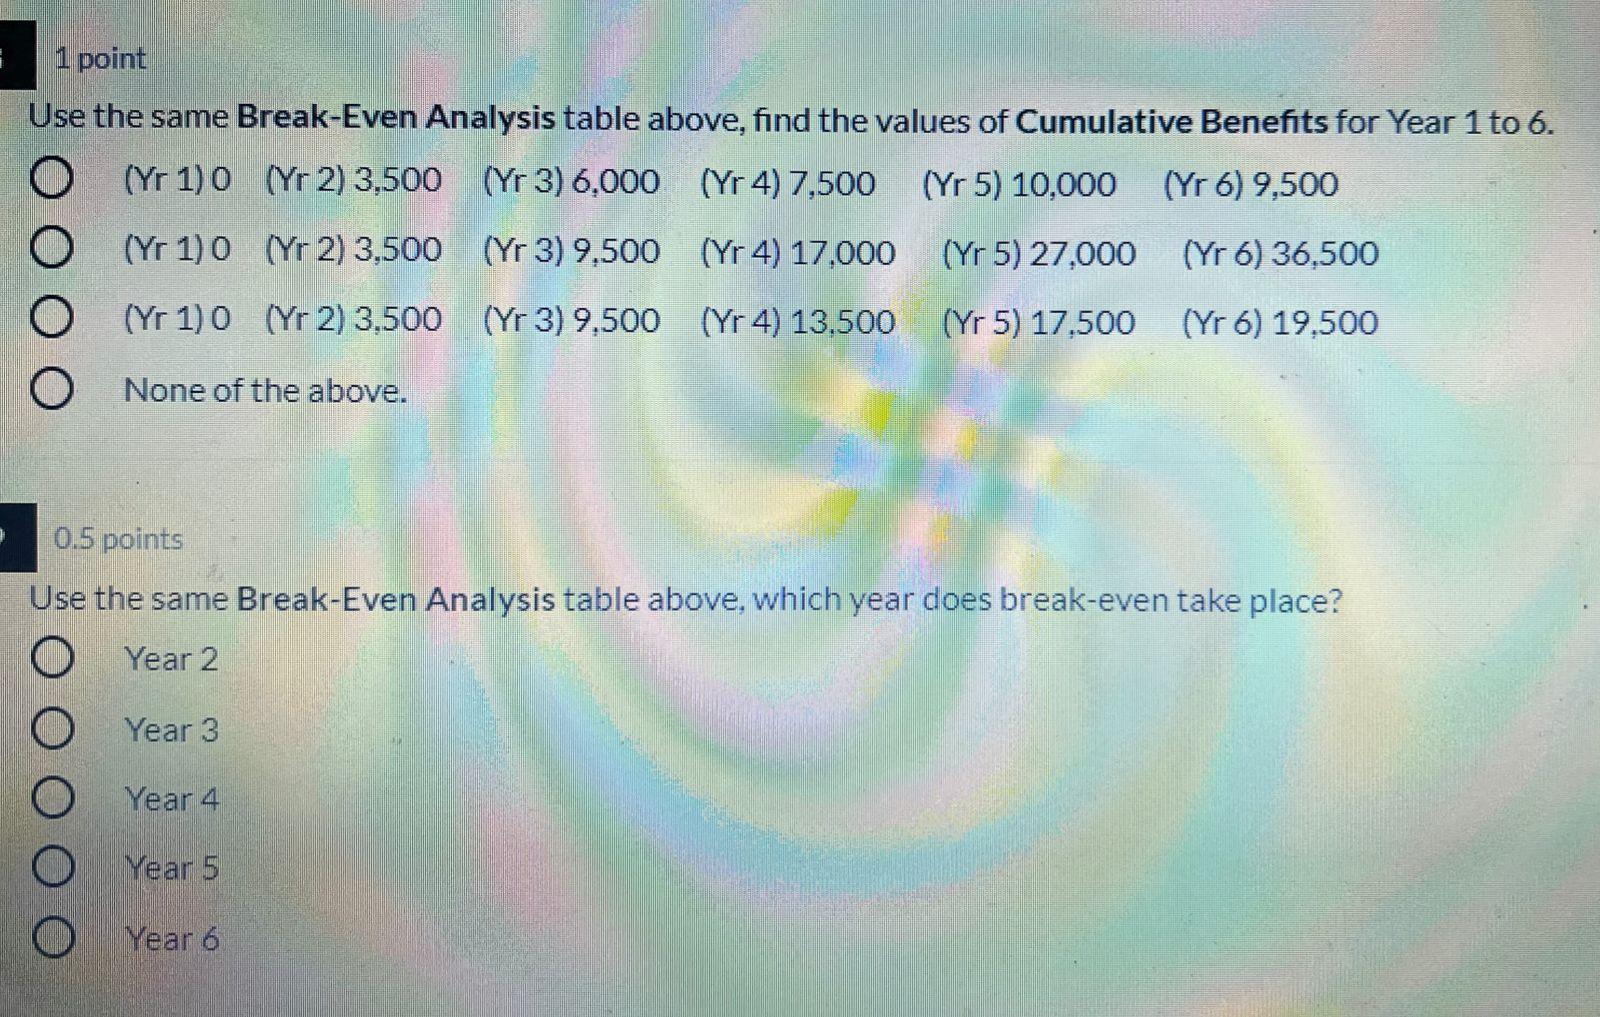
Use the Break-Even Analysis table below, find the values of Cumulative Costs for Year 1 to 6. Break-Even Analysis Table: Year Costs ($) Cumulative Costs ($) Benefits ($) Cumulative Benefits ($) 1 0 2 3 14.000 5.000 3.500 4.000 4.500 5,000 4 3.500 6.000 7.500 10.000 9.500 5 6 B (Yr 1) 14,000 (Yr 2) 19,000 (Yr 3) 8,500 (Yr 4) 7,500 (Yr 5) 8.500 (Yr 6) 9.500 (Yr 1) (Yr 2) 3,500 (Yr 3) 9,500 (Yr 4) 17,000 (Yr 5) 27,000 (Yr 6) 36,500 O (Yr 1) 14,000 (Yr 2) 19,000 (Yr 3) 22,500 (Yr 4) 26,500 (Yr 5)31,000 (Yr 6) 36,000 None of the above. 1 point Use the same Break-Even Analysis table above, find the values of Cumulative Benefits for Year 1 to 6. O (Yr 1) 0 (Yr 2) 3,500 (Yr 3) 6,000 (Yr 4) 7,500 (Yr 5) 10,000 (Yr 6) 9,500 O (Yr 1) 0 (Yr 2) 3,500 (Yr 3) 9,500 (Yr 4) 17.000 (Yr 5) 27,000 (Yr 6) 36,500 O (Yr 1) 0 (Yr 2) 3,500 (Yr 3) 9,500 (Yr 4) 13,500 (Yr 5) 17.500 (Yr 6) 19.500 O None of the above. 0.5 points Use the same Break-Even Analysis table above, which year does break-even take place? O Year 2 O Year 3 Year4 Year 5 Year 6
Step by Step Solution
There are 3 Steps involved in it

Get step-by-step solutions from verified subject matter experts