

Question: Answer all with complete solution, please. Enrichment Activity 7 Activities Describe and illustrate the skewness of the following data; a. -0.68 b. +0.75 c. -0.5
Answer all with complete solution, please.

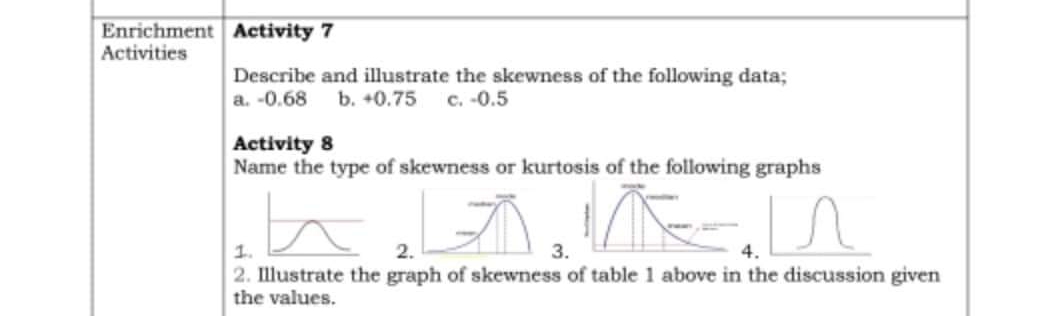
Enrichment Activity 7 Activities Describe and illustrate the skewness of the following data; a. -0.68 b. +0.75 c. -0.5 Activity 8 Name the type of skewness or kurtosis of the following graphs 1. 2. 3. 2. Illustrate the graph of skewness of table 1 above in the discussion given the values
Step by Step Solution
There are 3 Steps involved in it
1 Expert Approved Answer
Step: 1 Unlock

Question Has Been Solved by an Expert!
Get step-by-step solutions from verified subject matter experts
Step: 2 Unlock
Step: 3 Unlock