

Question: Answer and explain the reason with showing work 8. Consider data for four random variables T, U, V, W. For each variable, there are six
Answer and explain the reason with showing work
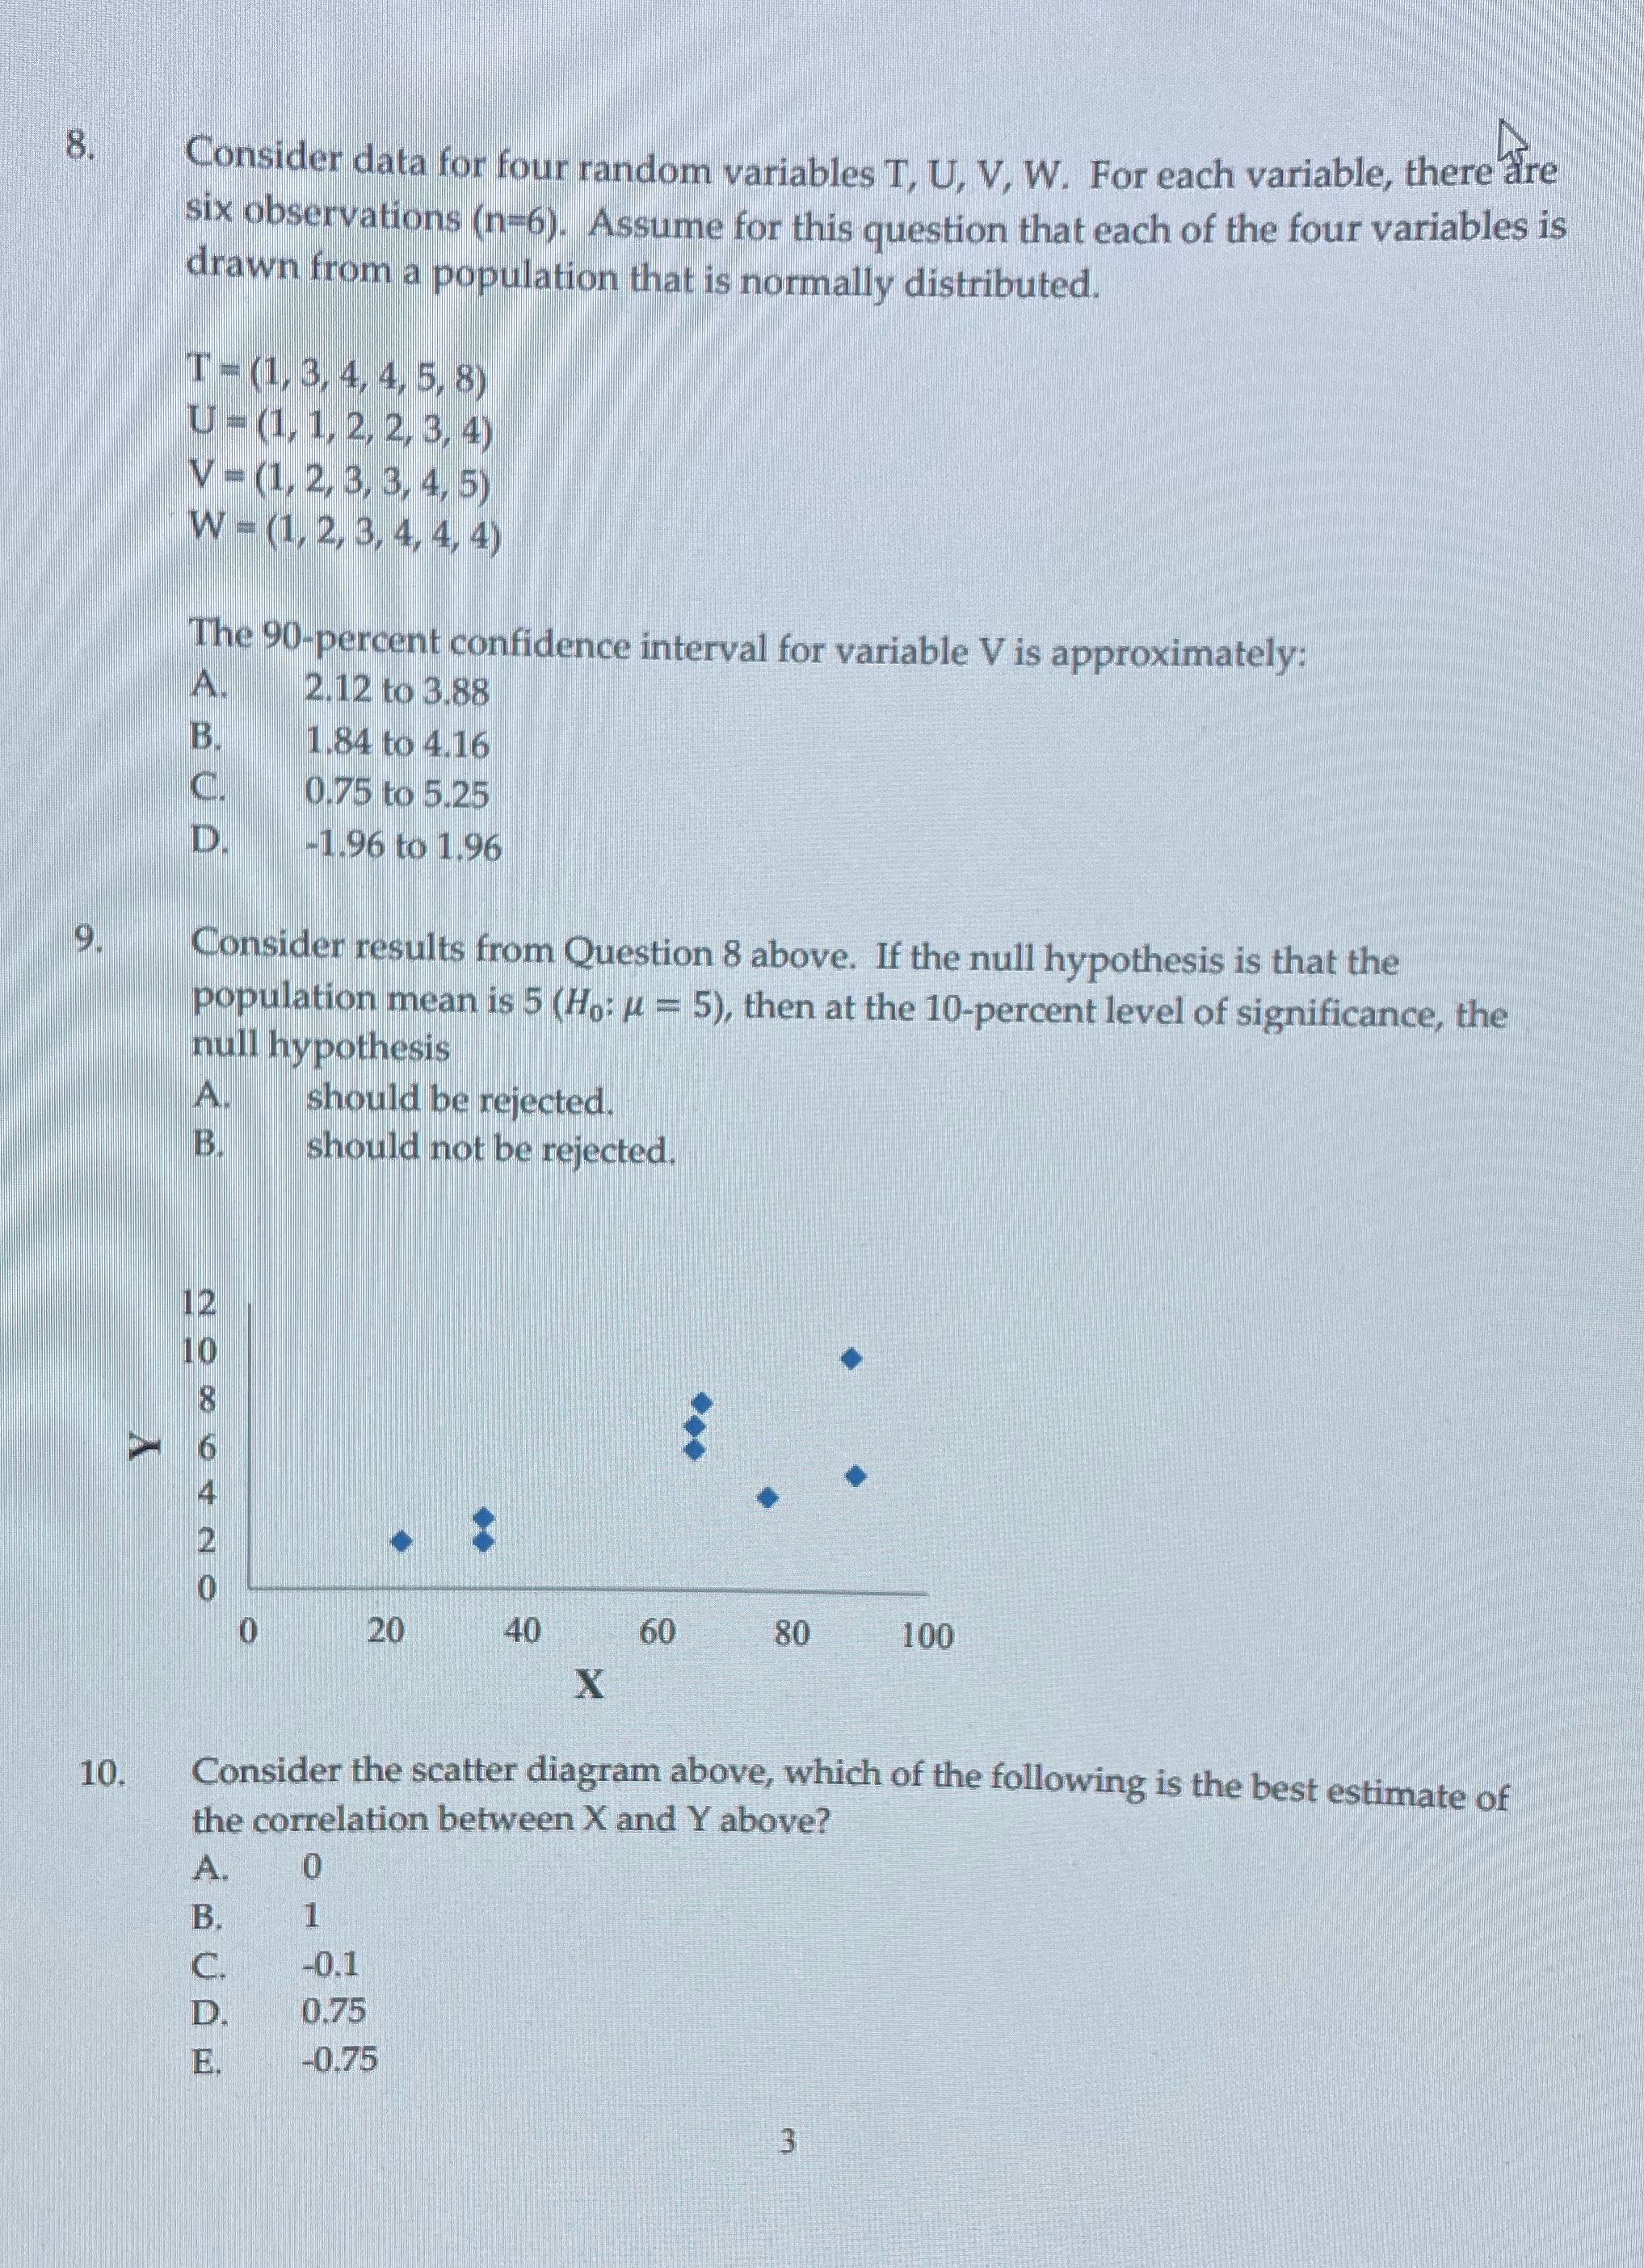
8. Consider data for four random variables T, U, V, W. For each variable, there are six observations (n=6). Assume for this question that each of the four variables is drawn from a population that is normally distributed. (1, 3, 4, 4, 5, 8) U - (1, 1, 2, 2, 3, 4) V - (1, 2, 3, 3, 4, 5) W - (1, 2, 3, 4, 4, 4 ) The 90-percent confidence interval for variable V is approximately: 2.12 to 3.88 B. 1.84 to 4.16 0.75 to 5.25 D -1.96 to 1.96 9. Consider results from Question 8 above. If the null hypothesis is that the population mean is 5 (Ho: # = 5), then at the 10-percent level of significance, the null hypothesis A should be rejected. B. should not be rejected. ONACOON 0 20 40 60 80 100 X 10. Consider the scatter diagram above, which of the following is the best estimate of the correlation between X and Y above? A. 0 B. C. -0.1 D. 0.75 E. -0.75
Step by Step Solution
There are 3 Steps involved in it

Get step-by-step solutions from verified subject matter experts