

Question: Answer and explain these questions please. Part B: 6. Use the equation to predict the brain weight, to the nearest gram, of a mammal whose
Answer and explain these questions please.
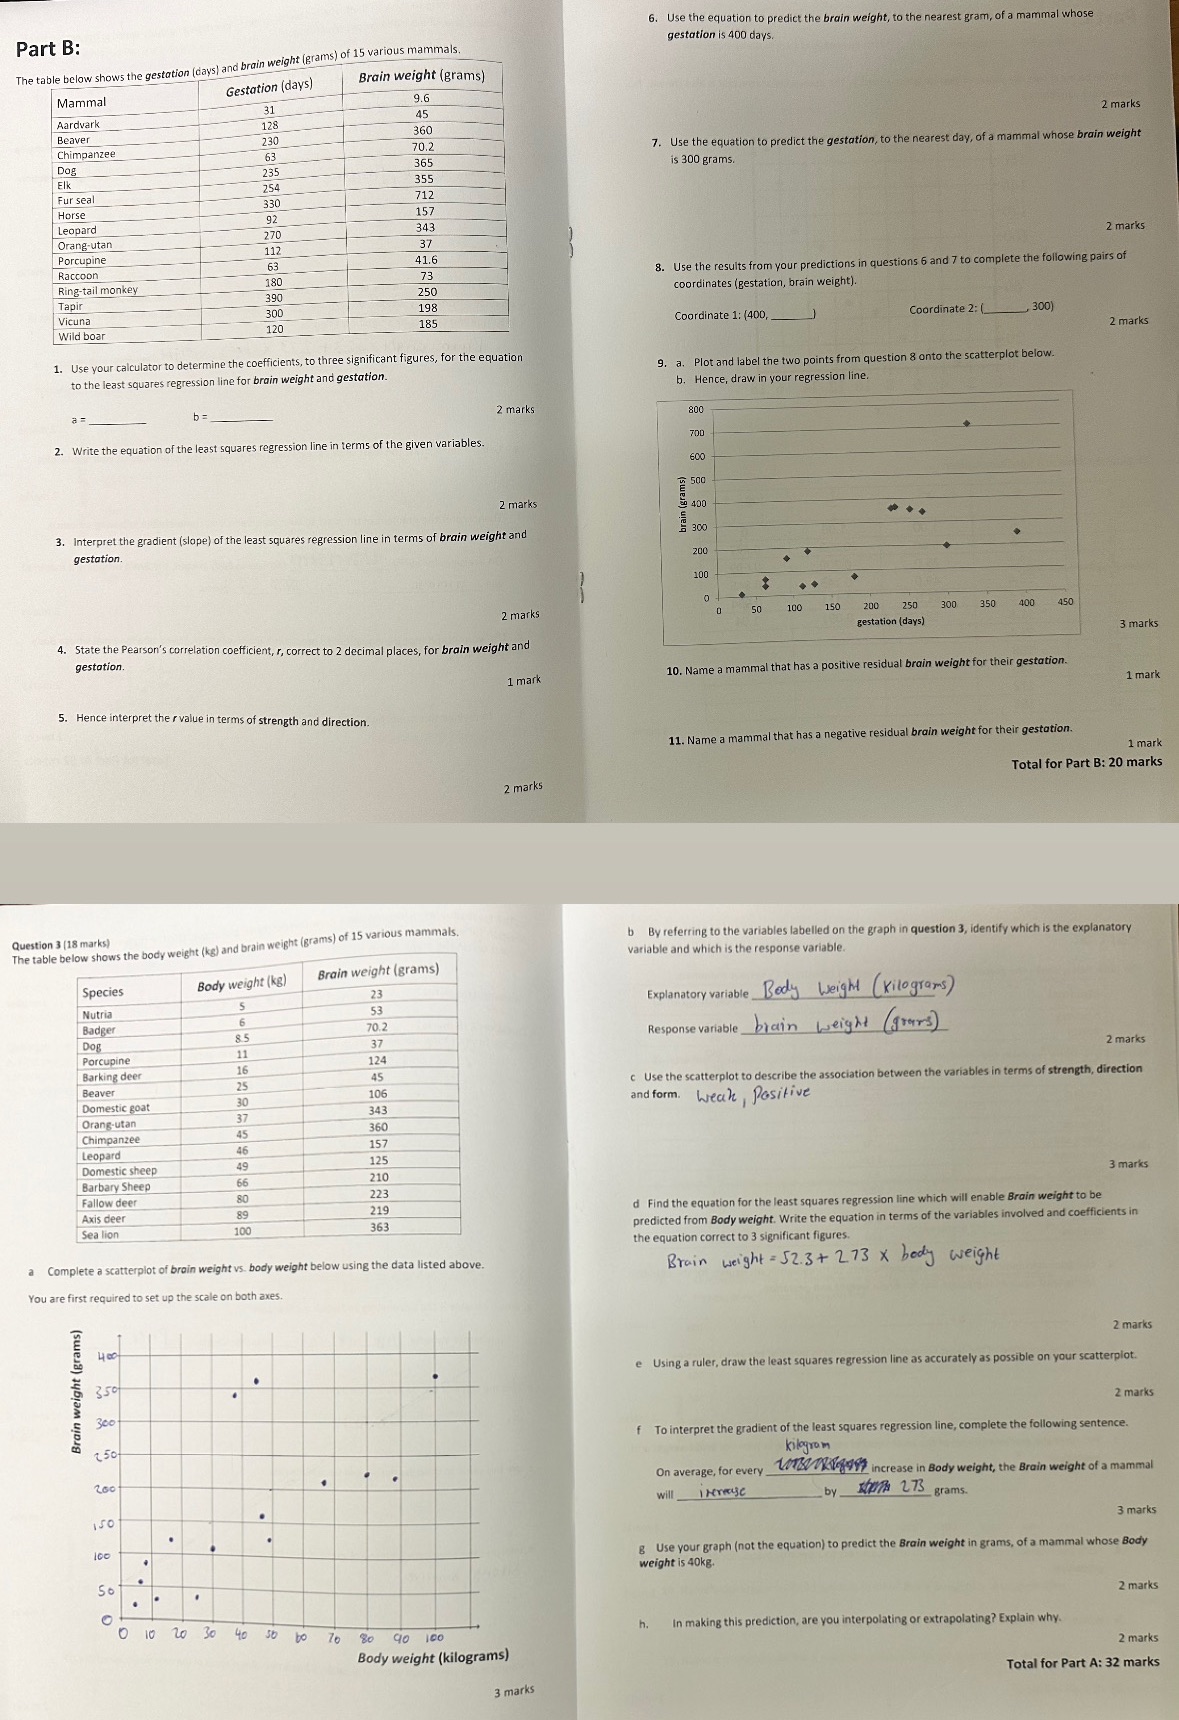
Part B: 6. Use the equation to predict the brain weight, to the nearest gram, of a mammal whose gestation is 400 days. The table below shows the gestation (days) and brain weight (grams) of 15 various mammals. Gestation (days) Brain weight (grams) Mammal 9.6 31 Aardvark 45 128 2 marks Beaver 230 360 Chimpanzee 63 70.2 7. Use the equation to predict the gestation, to the nearest day, of a mammal whose brain weight Dog 235 365 is 300 grams . Elk 254 355 Fur seal 330 712 Horse 92 157 Leopard 343 Orang-utan 270 112 37 Porcupine 2 marks Raccoon 63 41.6 Ring-tail monkey 180 73 8. Use the results from your predictions in questions 6 and 7 to complete the following pairs of Tapir 390 250 coordinates ( gestation, brain weight). Vicuna 300 198 Wild boar 120 185 Coordinate 1: (400,_ Coordinate 2:(_ 300) 2 marks 1. Use your calculator to determine the coefficients, to three significant figures, for the equation to the least squares regression line for brain weight and gestation. 9. a. Plot and label the two points from question 8 onto the scatterplot below. b. Hence, draw in your regression line 2 marks 800 2. Write the equation of the least squares regression line in terms of the given variables. 700 600 500 2 marks 400 3. Interpret the gradient (slope) of the least squares regression line in terms of brain weight and gestation 200 100 2 marks 50 100 150 200 250 300 350 400 450 gestation (days) 4. State the Pearson's correlation coefficient, r, correct to 2 decimal places, for brain weight and 3 marks gestation. 1 mark 10. Name a mammal that has a positive residual brain weight for their gestation. 1 mark 5. Hence interpret the rvalue in terms of strength and direction. 11. Name a mammal that has a negative residual brain weight for their gestation. 1 mark 2 marks Total for Part B: 20 marks Question 3 (18 marks) The table below shows the body weight (kg) and brain weight (grams) of 15 various mammals, b By referring to the variables labelled on the graph in question 3, identify which is the explanatory variable and which is the response variable. Brain weight (grams) Species Body weight (kg) 23 |Nutria 53 Explanatory variable Body Weight (kilograms) Badger 6 70.2 Dog 85 37 Response variable brain weight ( gears ) Porcupine 11 2 marks Barking deer 16 124 25 45 Beaver 30 106 c Use the scatterplot to describe the association between the variables in terms of strength, direction Domestic goat 343 and form. Weak, Positive Orang-utan Chimpanzee 45 360 Leopard 46 157 Domestic sheep 49 125 Barbary Sheep 66 210 3 marks Fallow deer 80 223 Axis deer 89 219 d Find the equation for the least squares regression line which will enable Brain weight to be Sea lion 100 363 predicted from Body weight. Write the equation in terms of the variables involved and coefficients in the equation correct to 3 significant figures. Complete a scatterplot of brain weight vs. body weight below using the data listed above. Brain weight = 52.3+ 273 X body weight You are first required to set up the scale on both axes. 400 2 marks e Using a ruler, draw the least squares regression line as accurately as possible on your scatterplot. Brain weight (grams) 350 300 2 marks 150 To interpret the gradient of the least squares regression line, complete the following sentence. kilogram 200 On average, for every _W/7K18997 increase in Body weight, the Brain weight of a mammal will by 102071 275 grams. 150 3 marks g Use your graph (not the equation) to predict the Brain weight in grams, of a mammal whose Body weight is 40kg. 501 2 marks 10 20 30 40 50 60 70 80 90 100 h. In making this prediction, are you interpolating or extrapolationg? Explain why. Body weight (kilograms) 2 marks Total for Part A: 32 marks 3 marks
Step by Step Solution
There are 3 Steps involved in it

Get step-by-step solutions from verified subject matter experts