

Question: Answer and give an explanation, please 1. Cost, Pr MC ATC $10.0 P=MR 8.0 $7.5 $5.0 $2.5 $0.0 0 10 20 30 40 50 60


Answer and give an explanation, please
1.
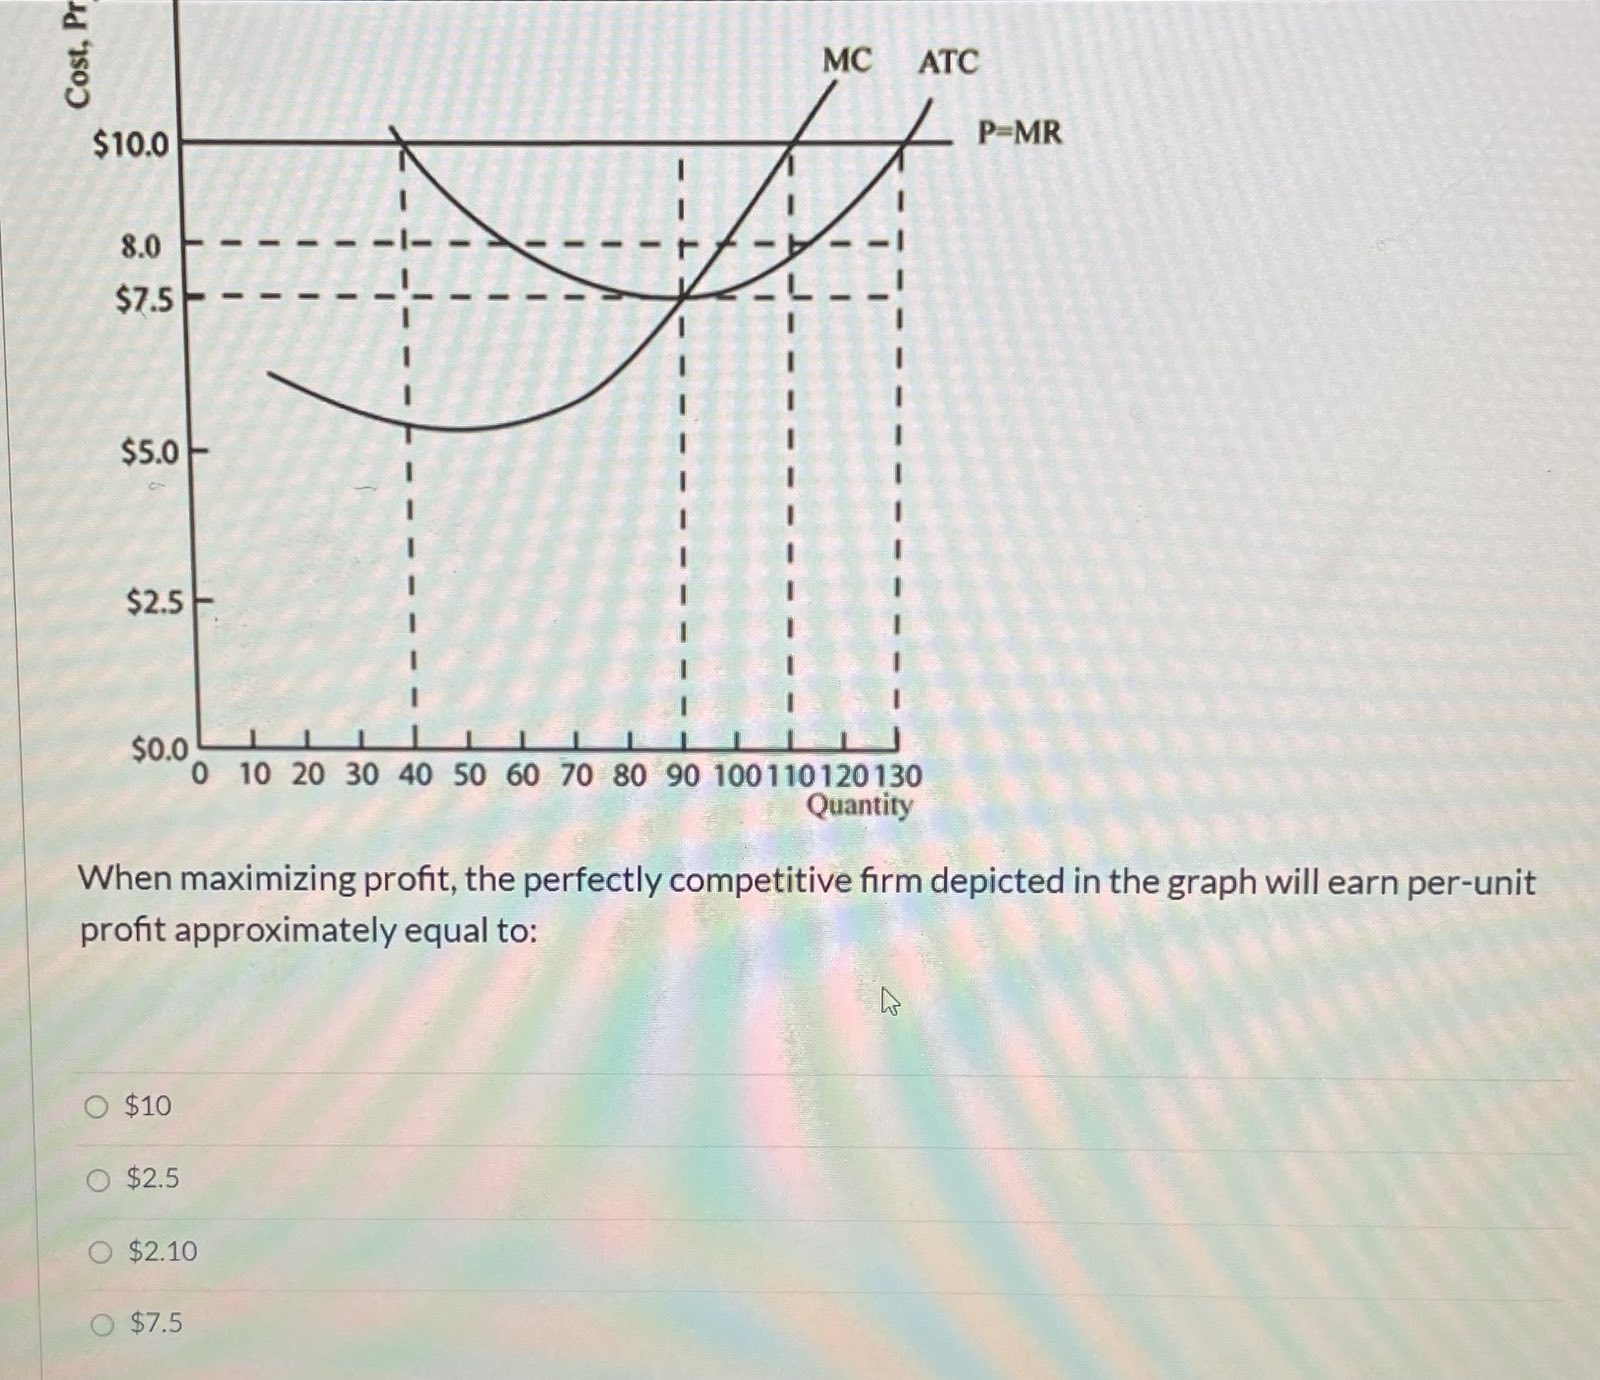

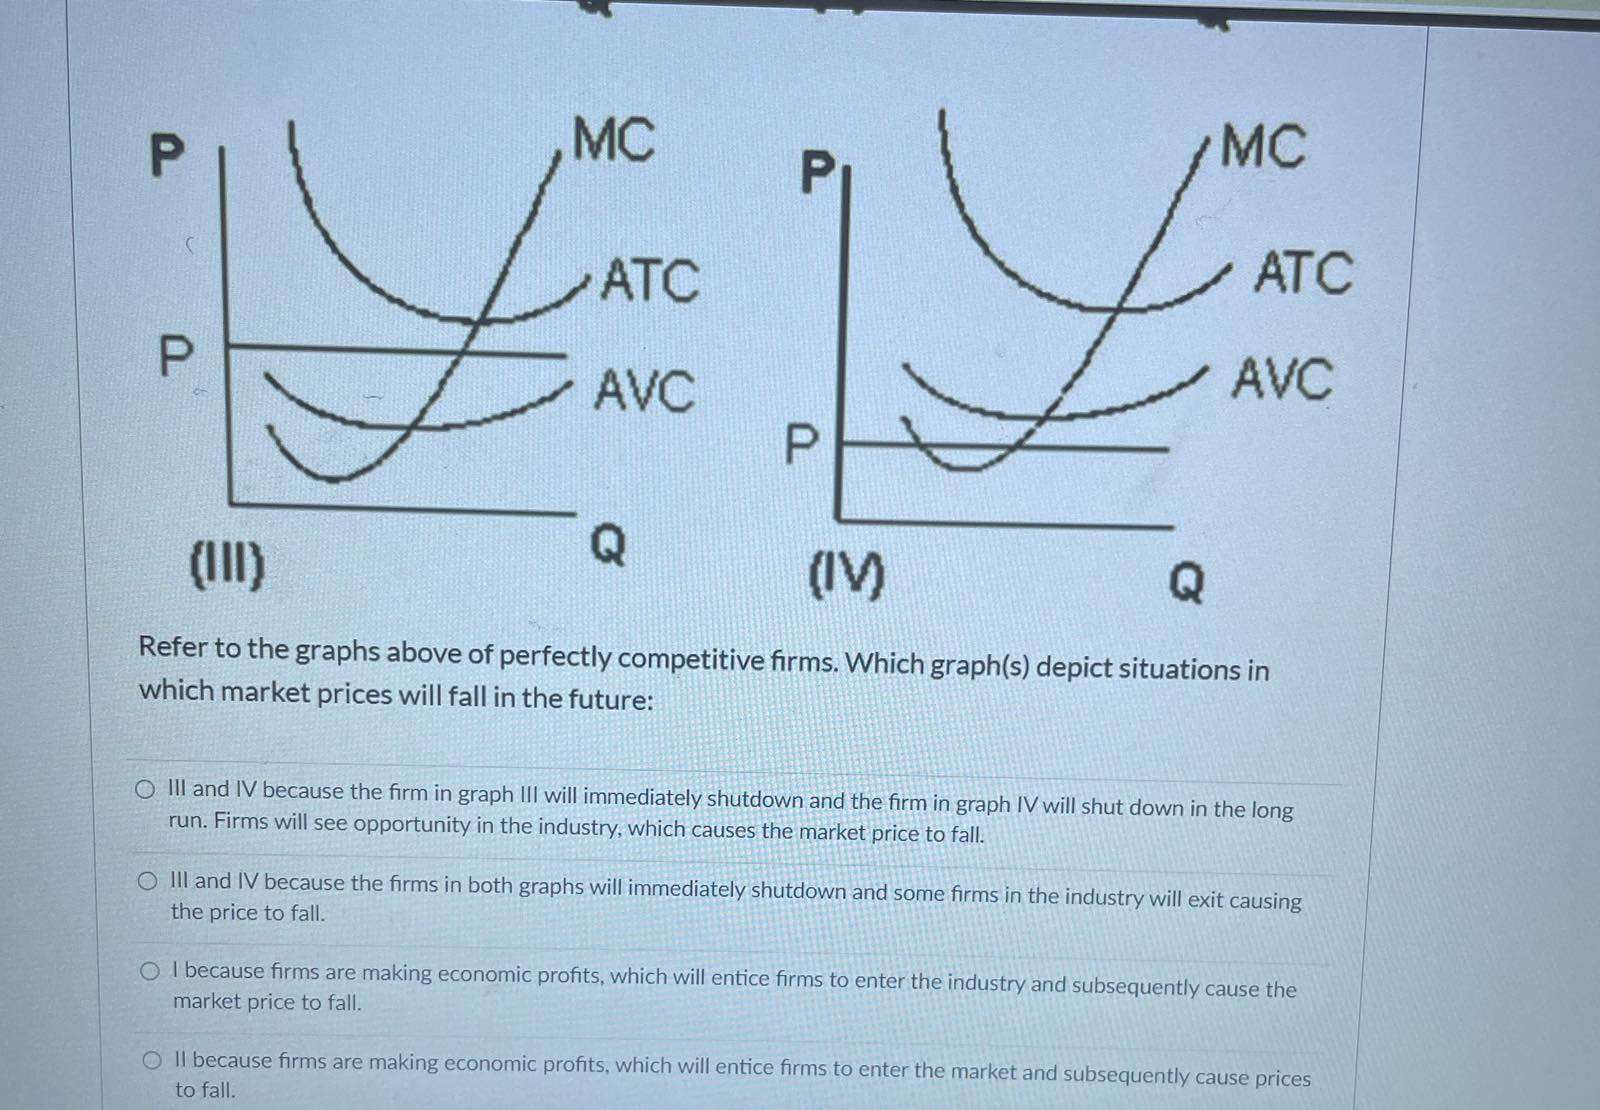


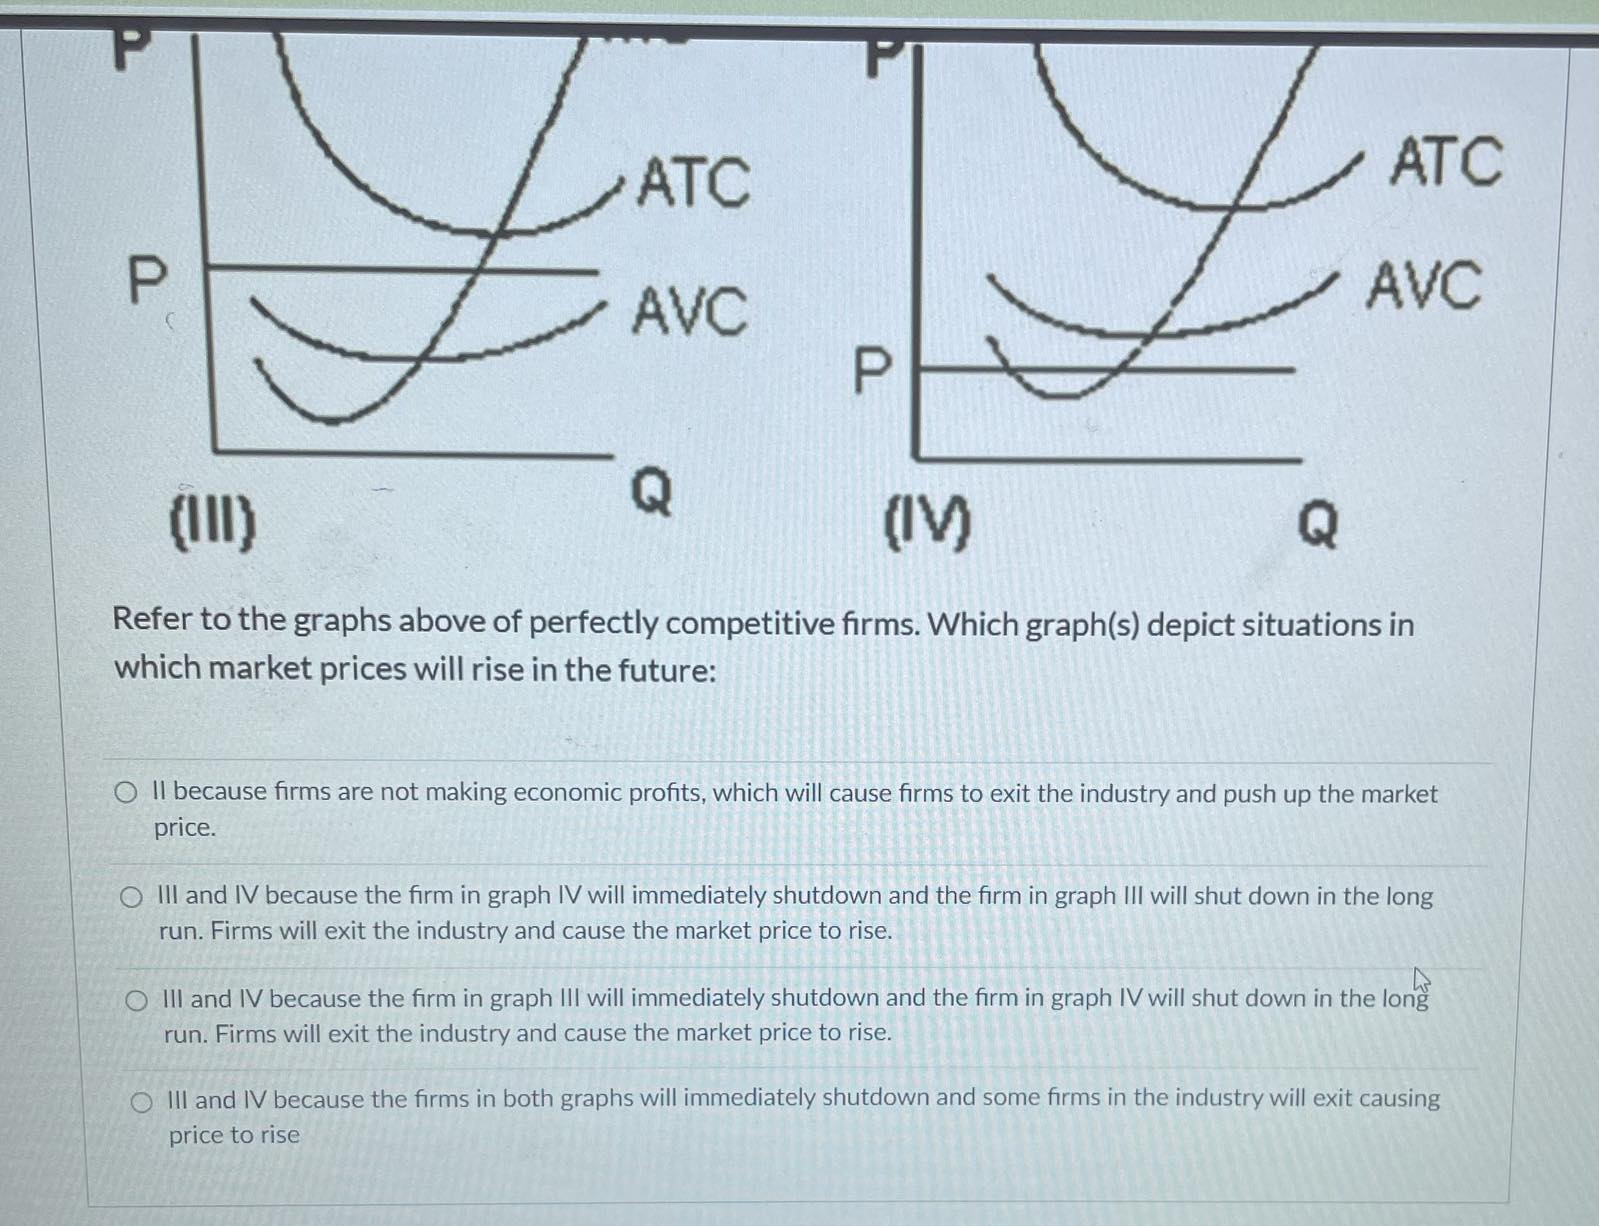

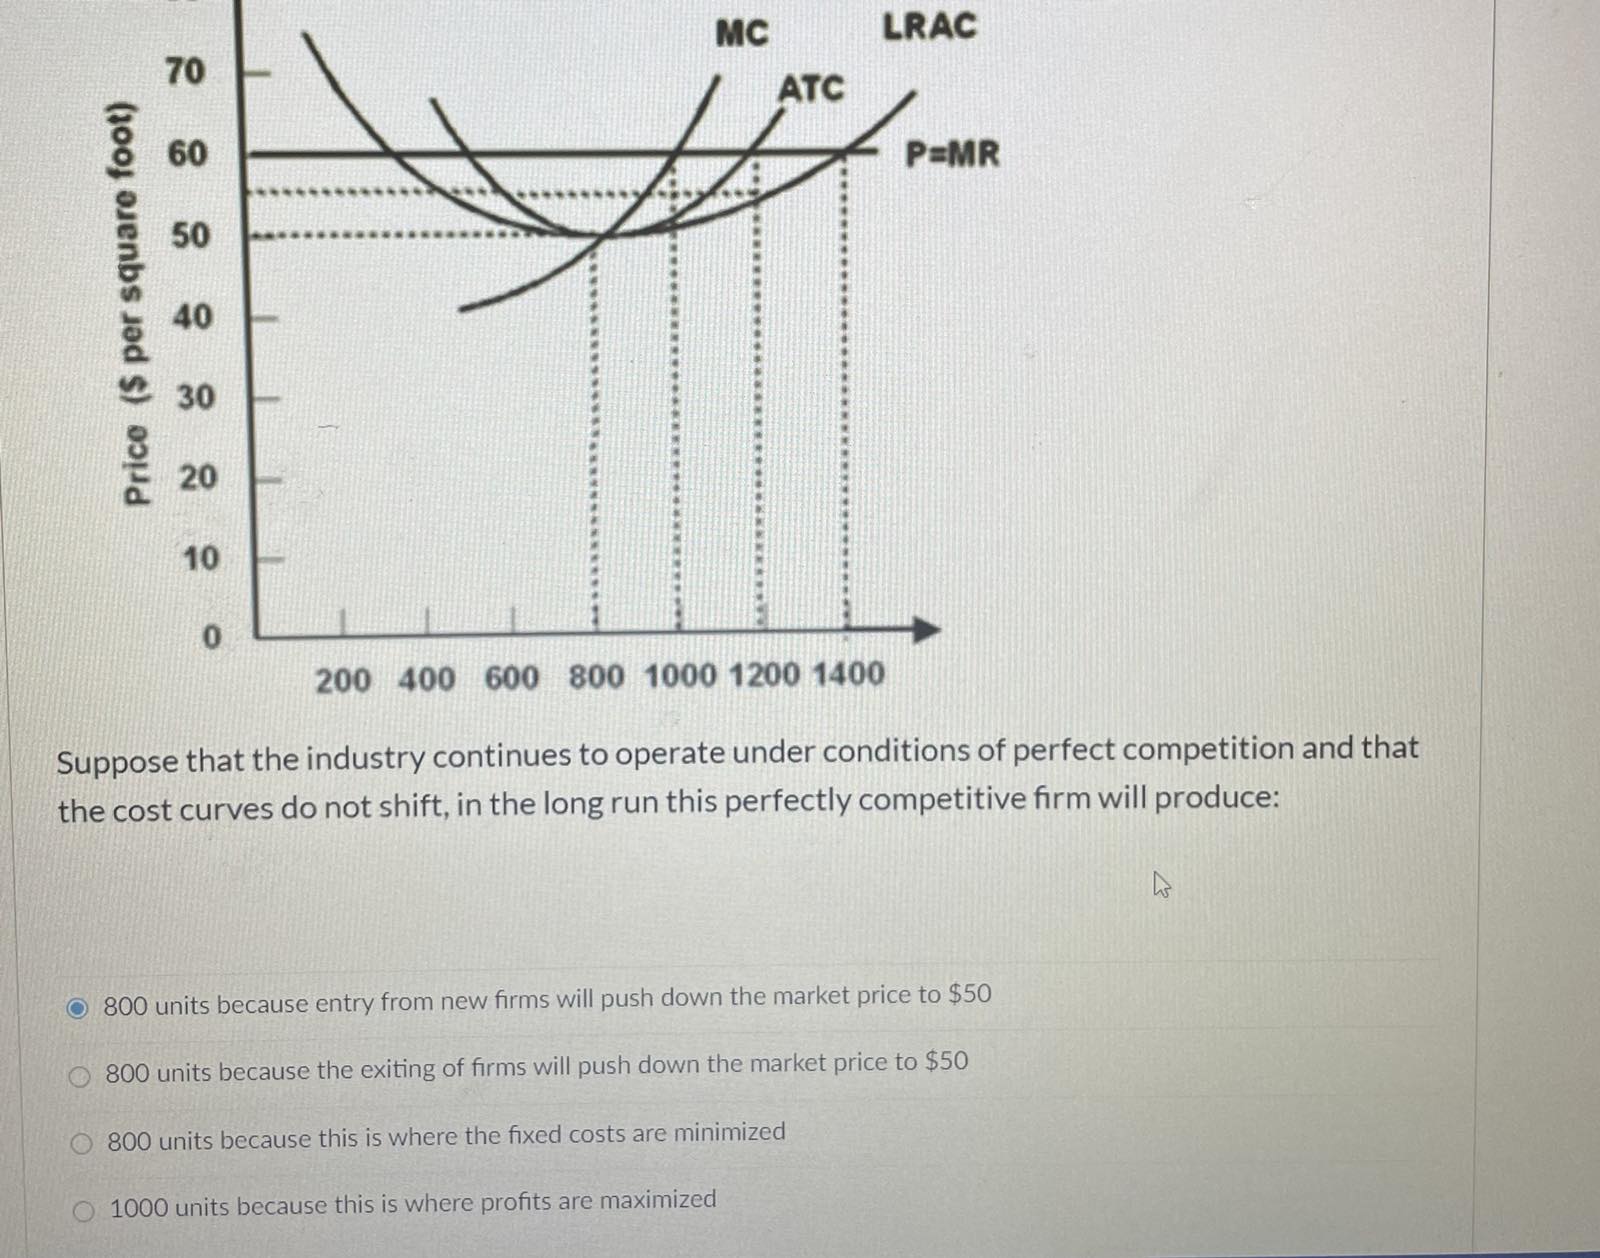

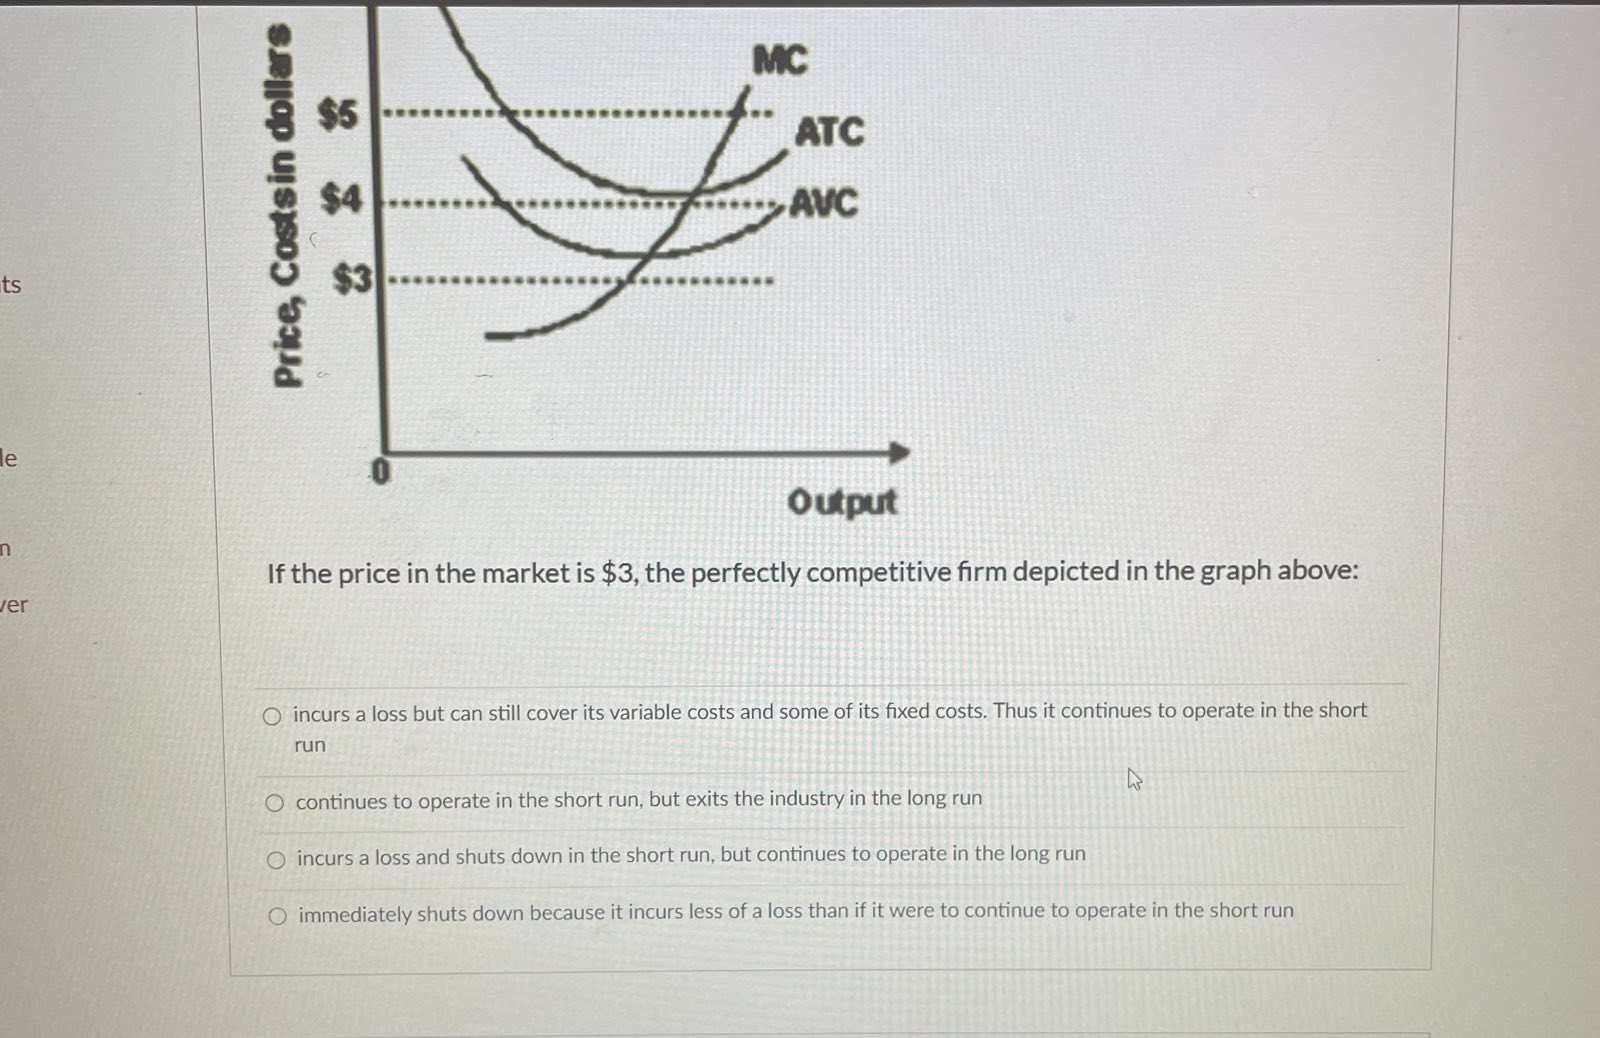

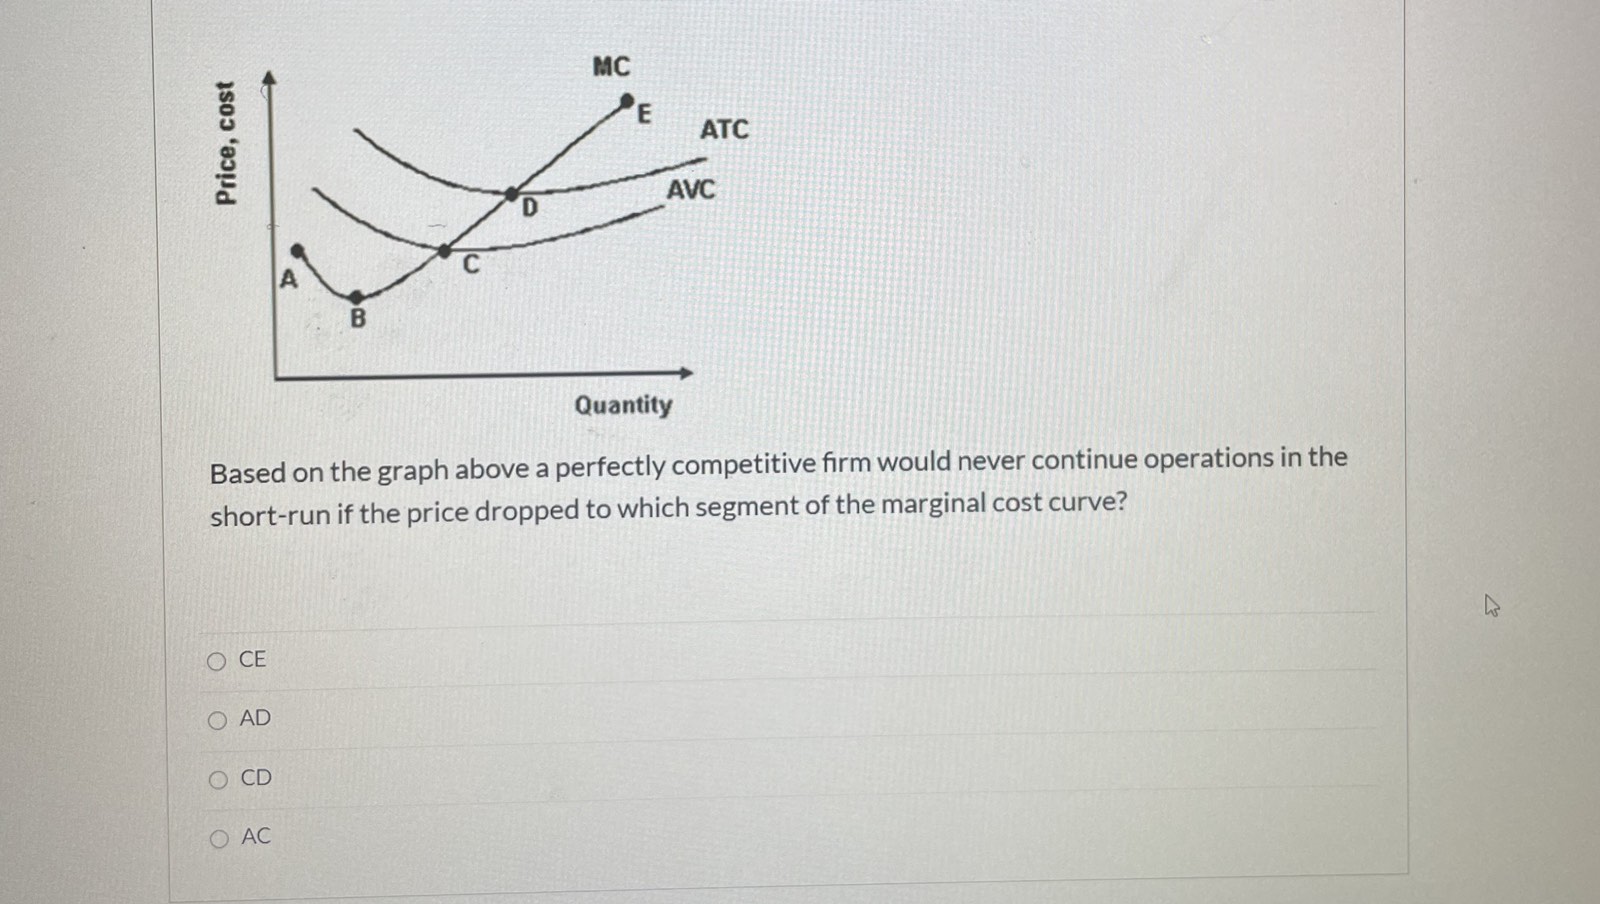
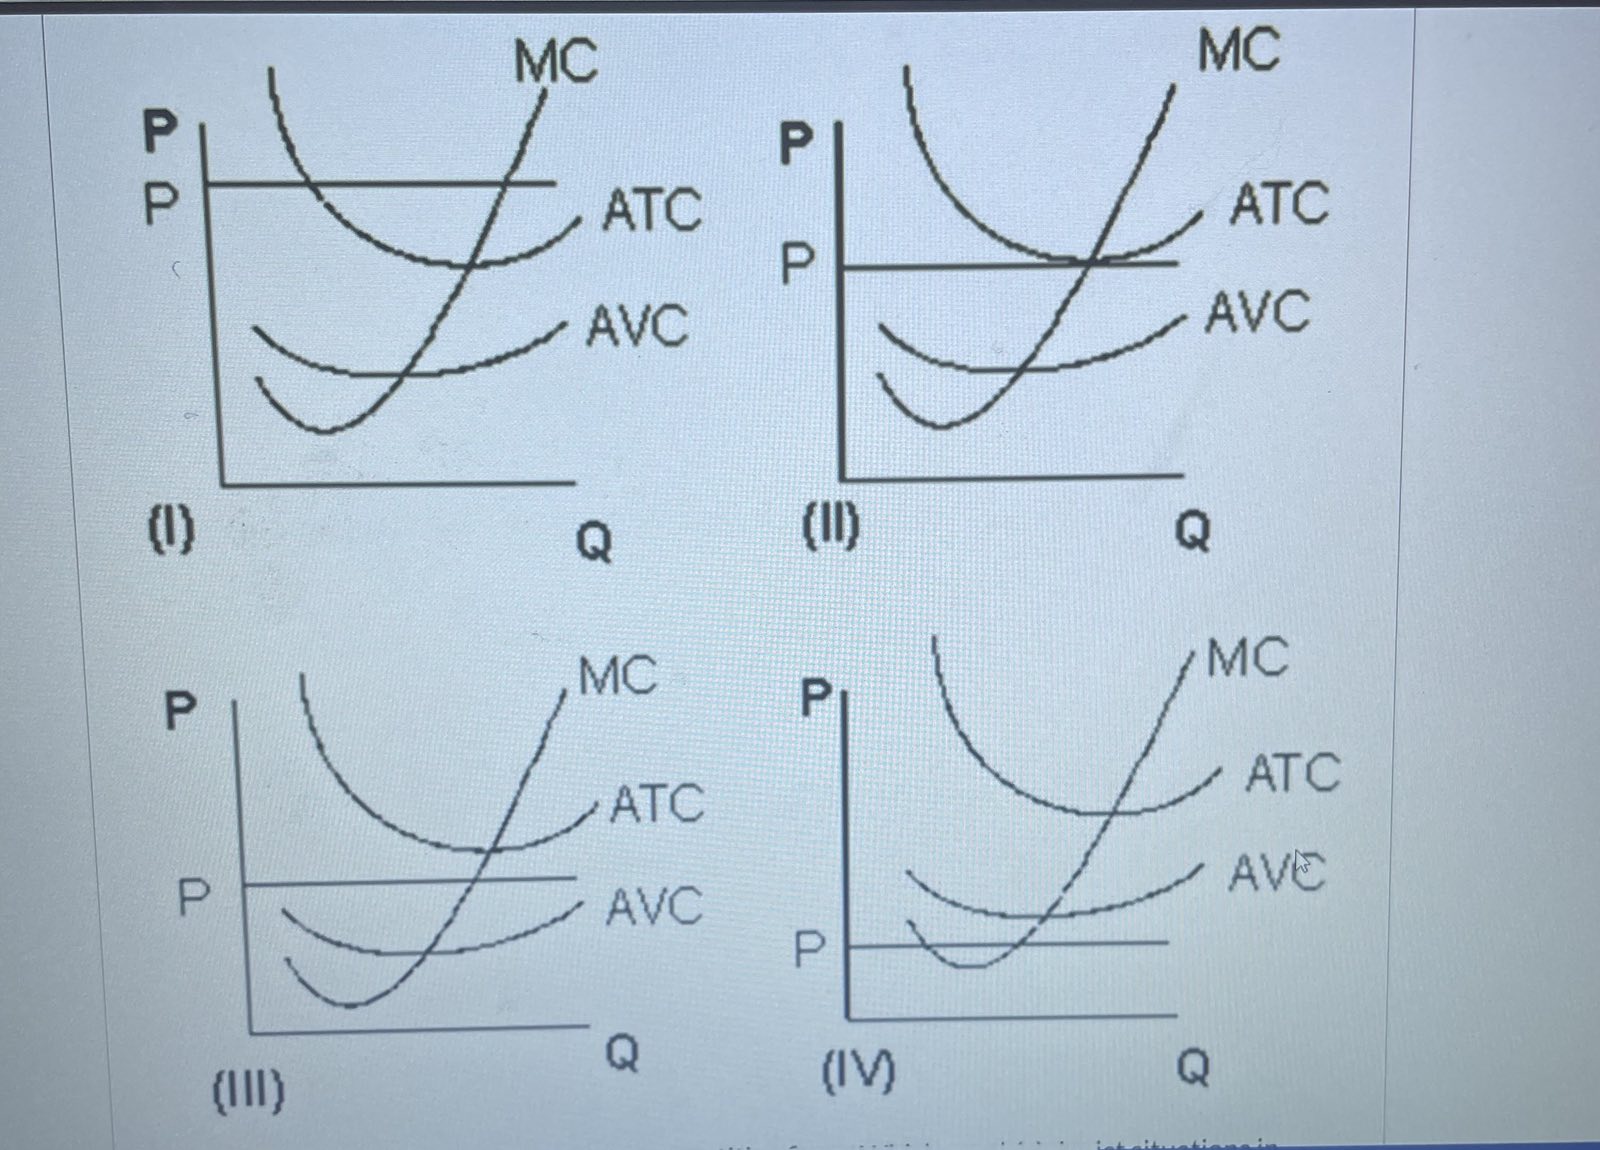
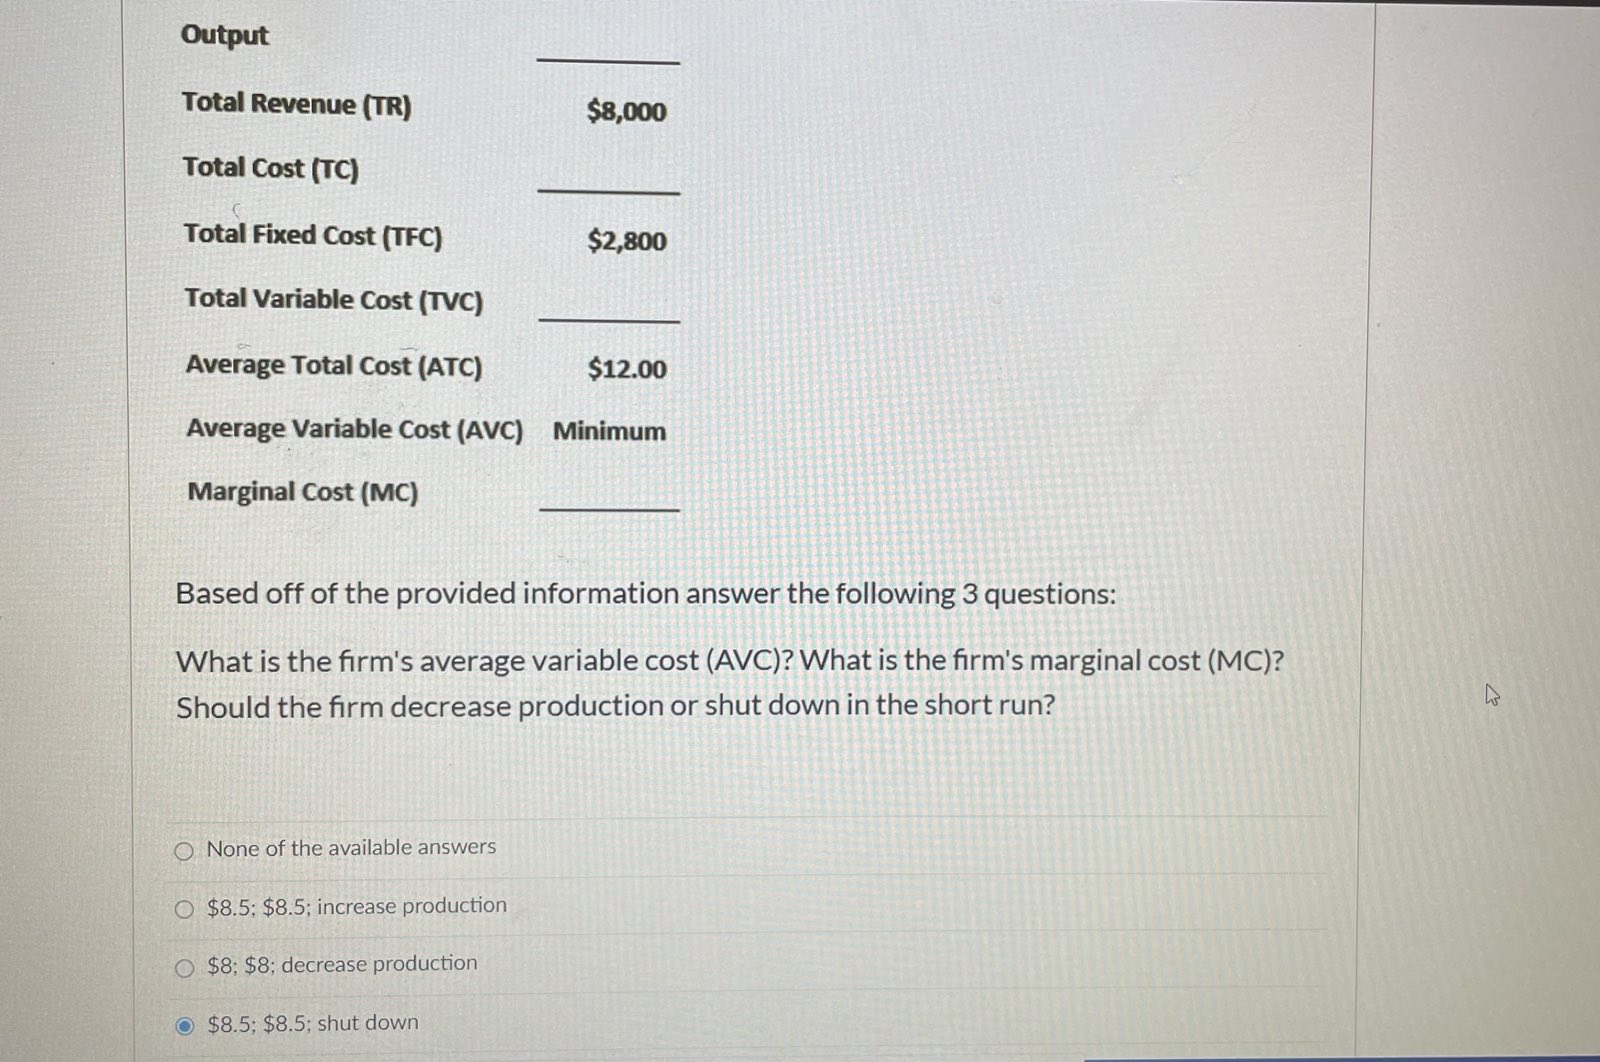
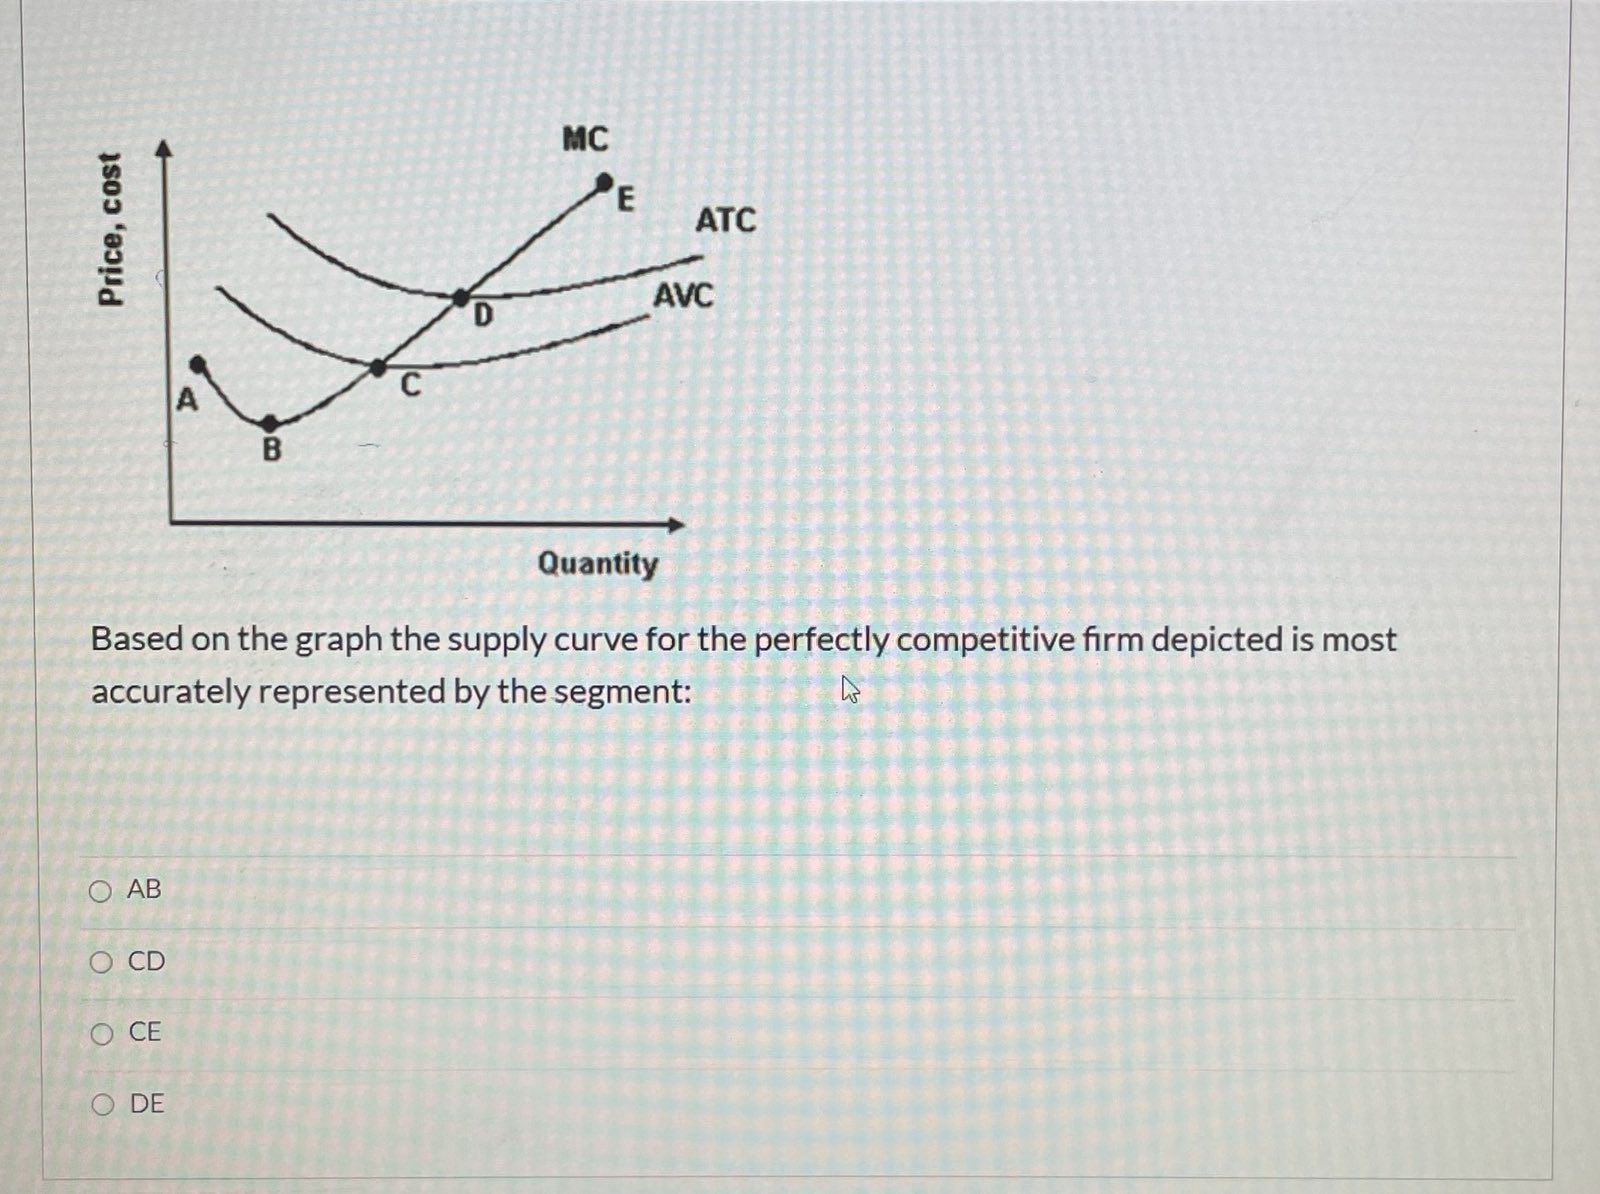
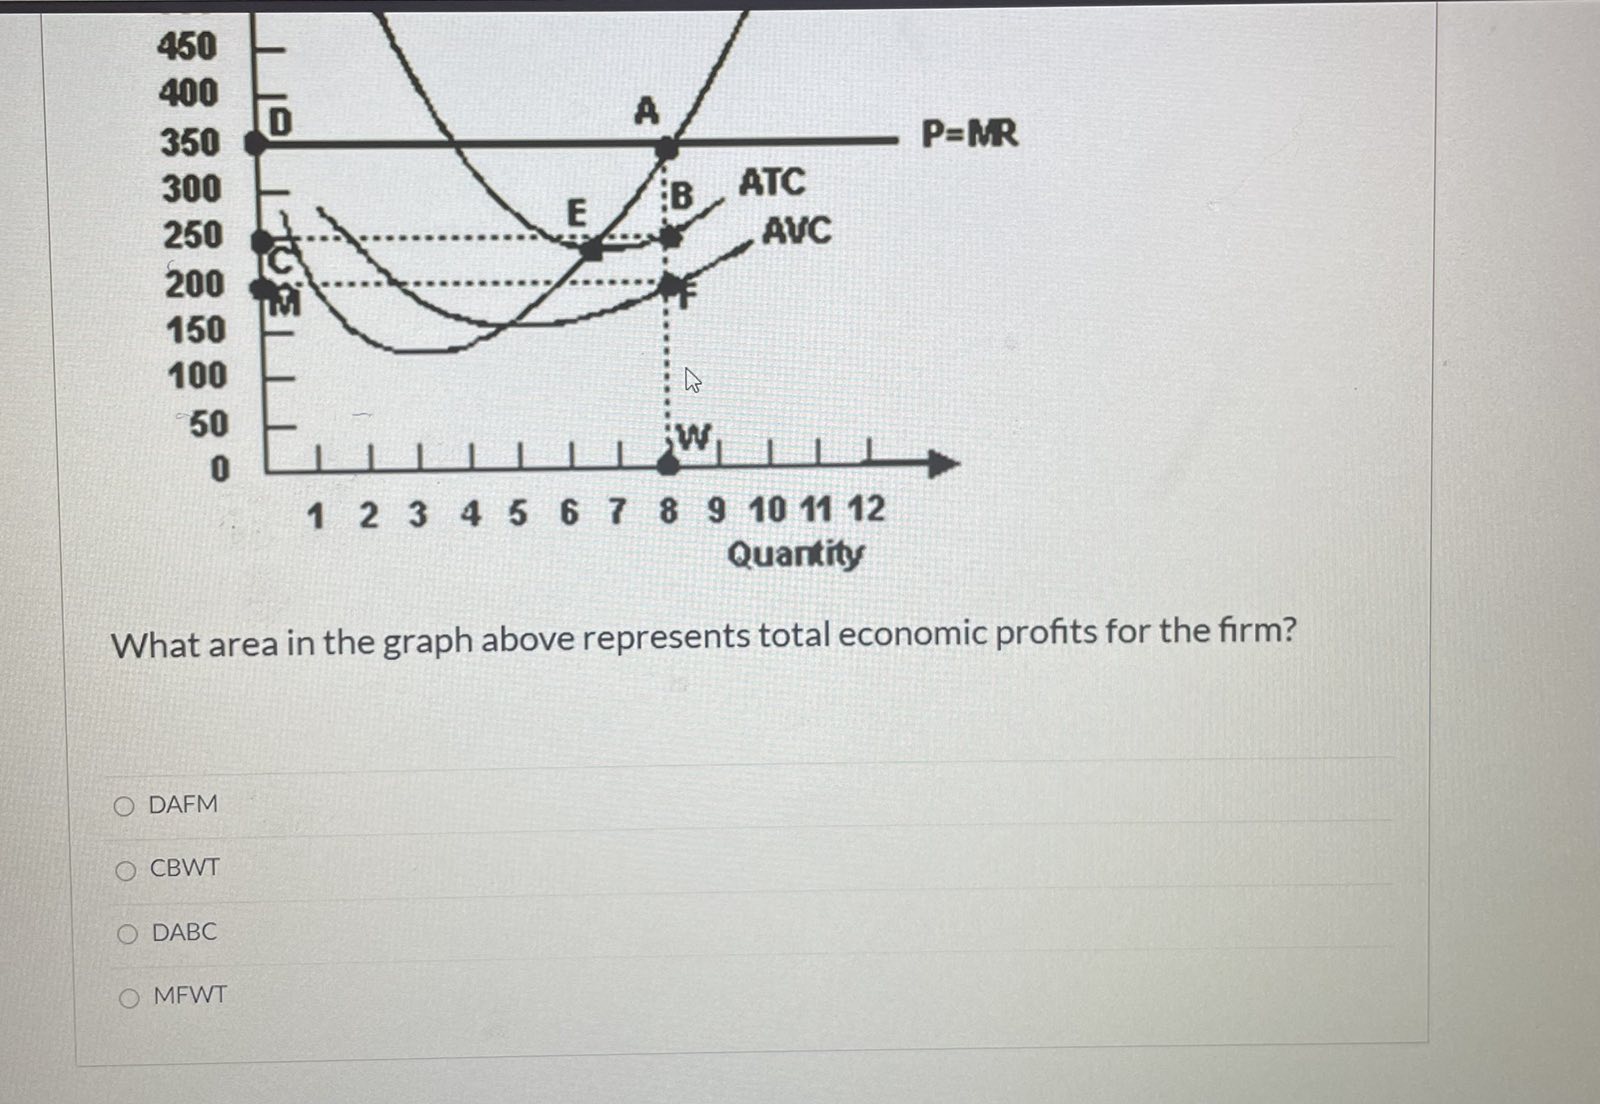
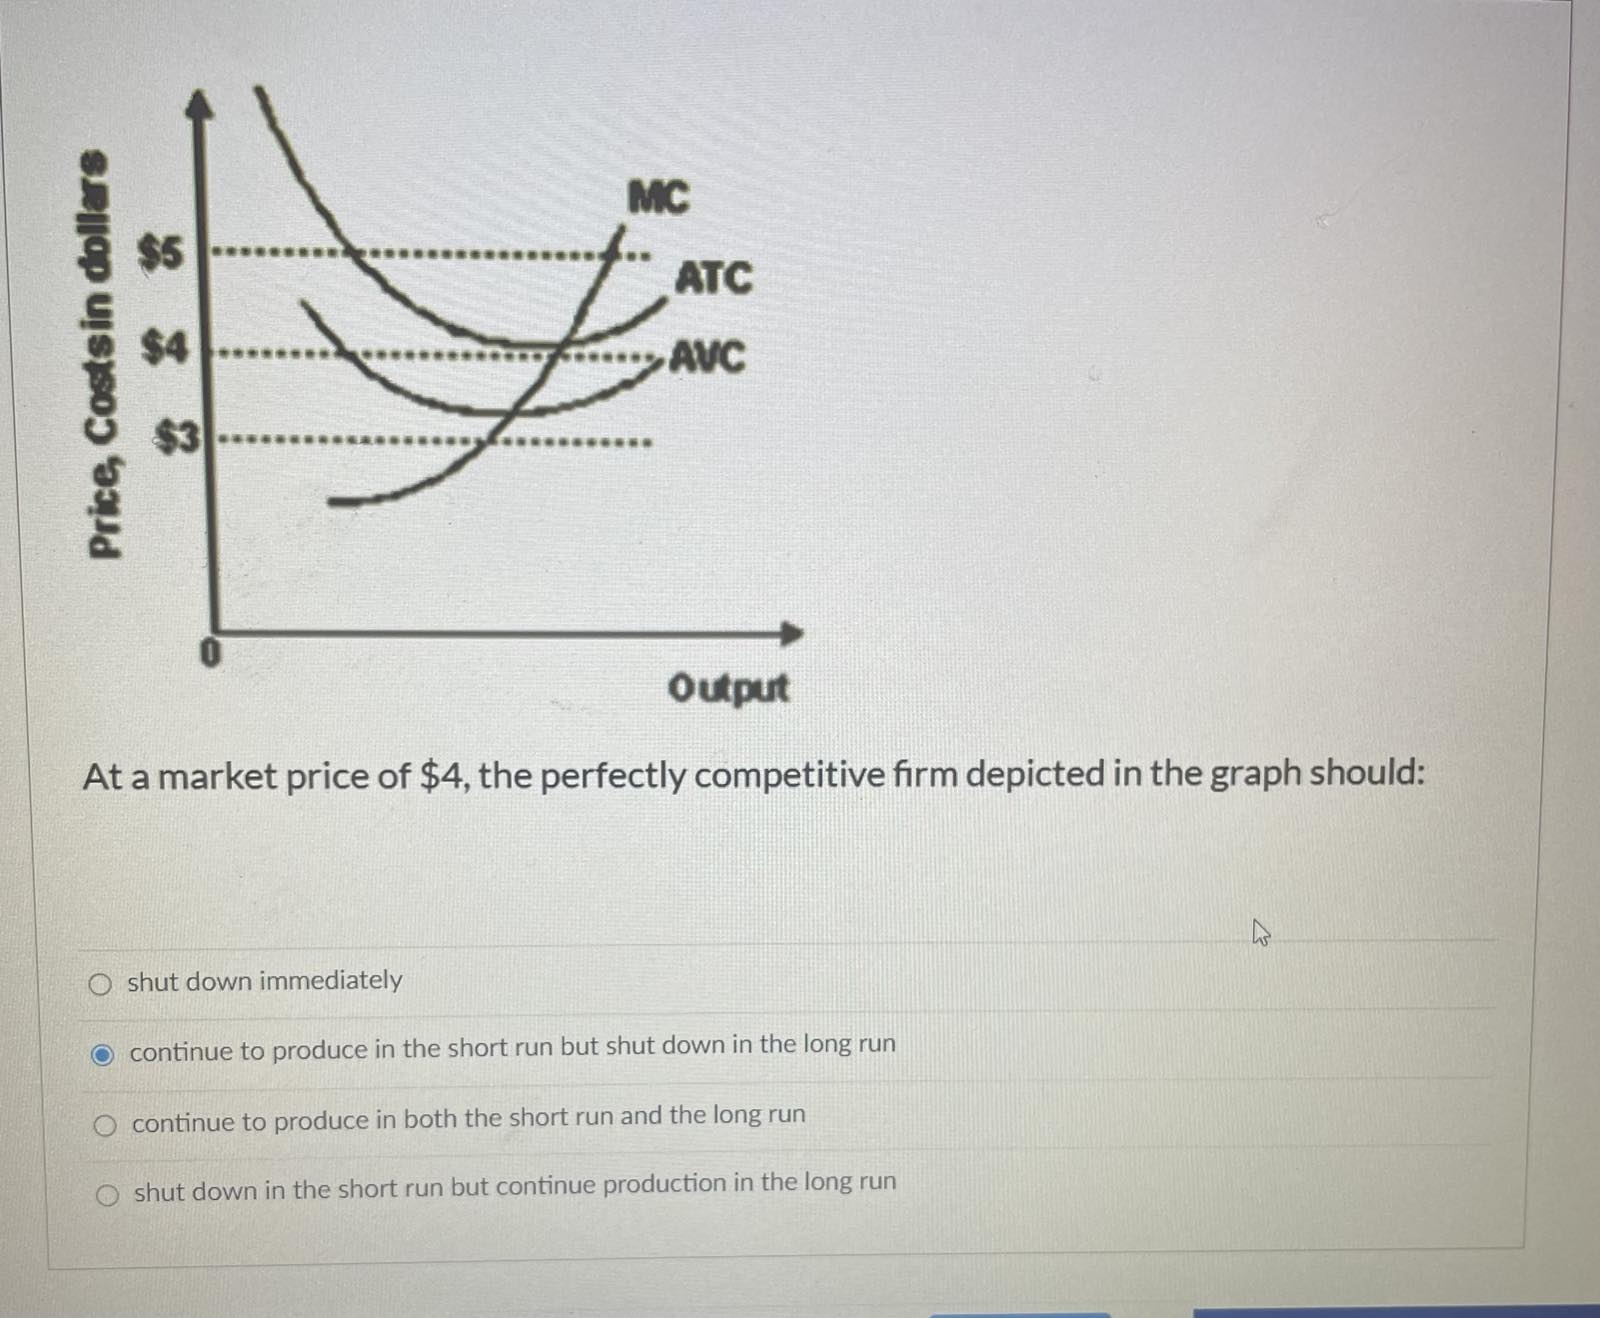
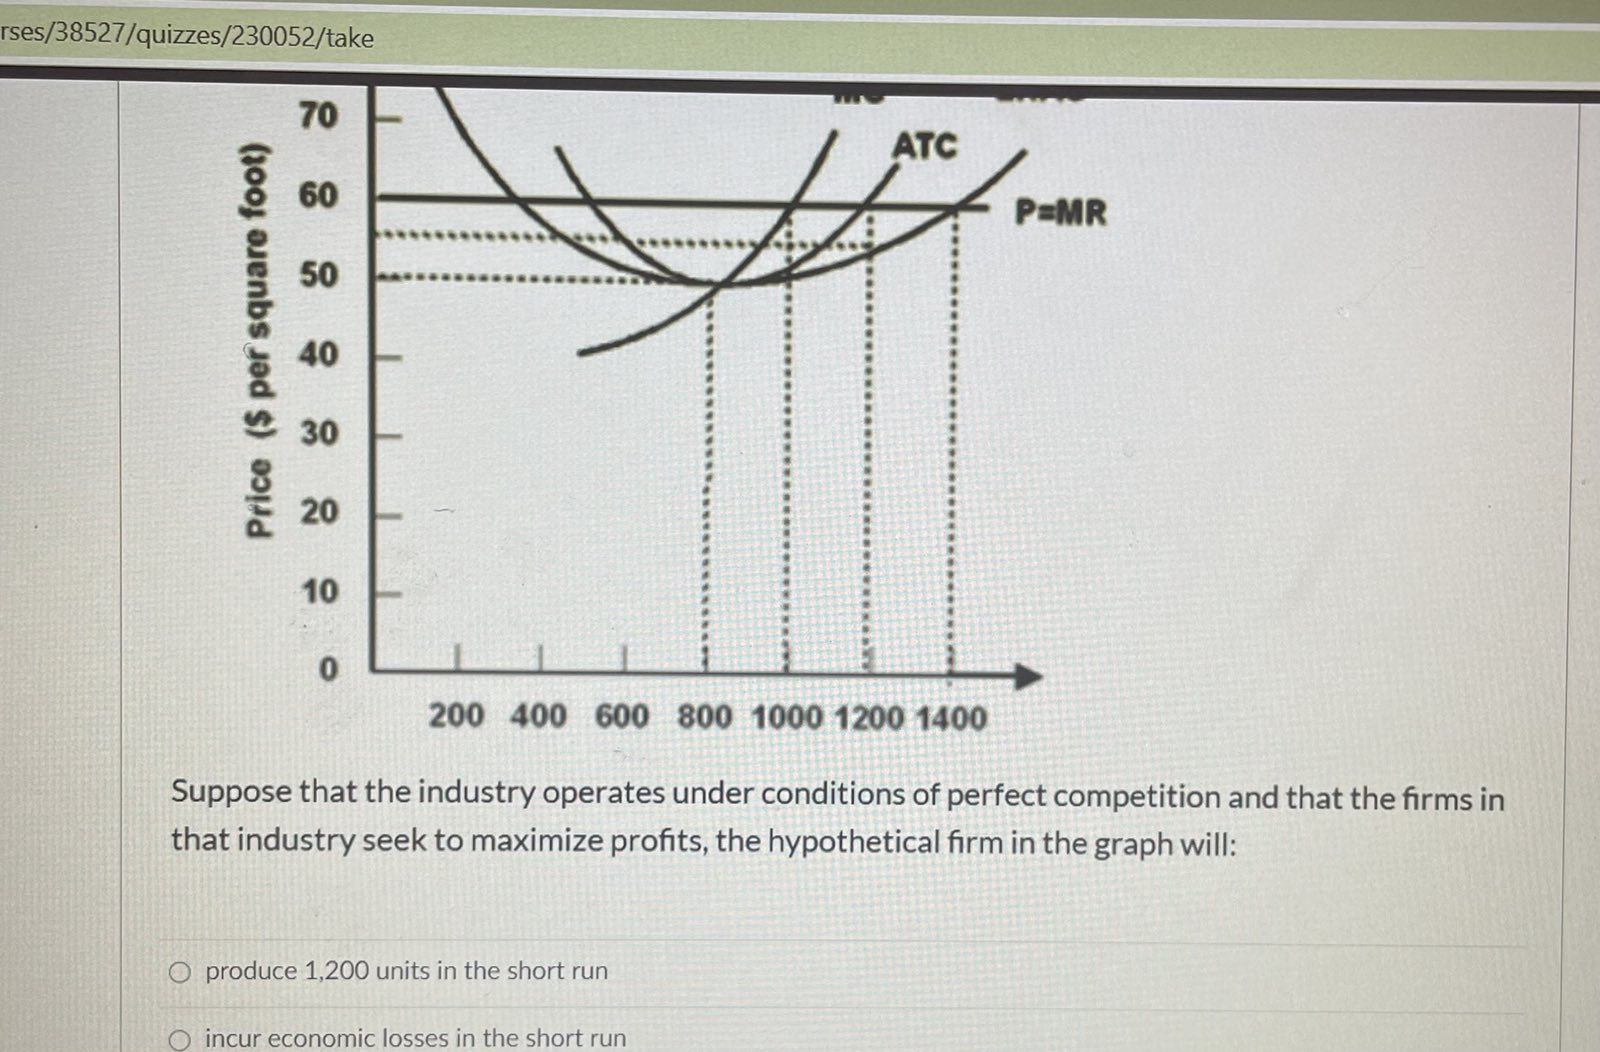
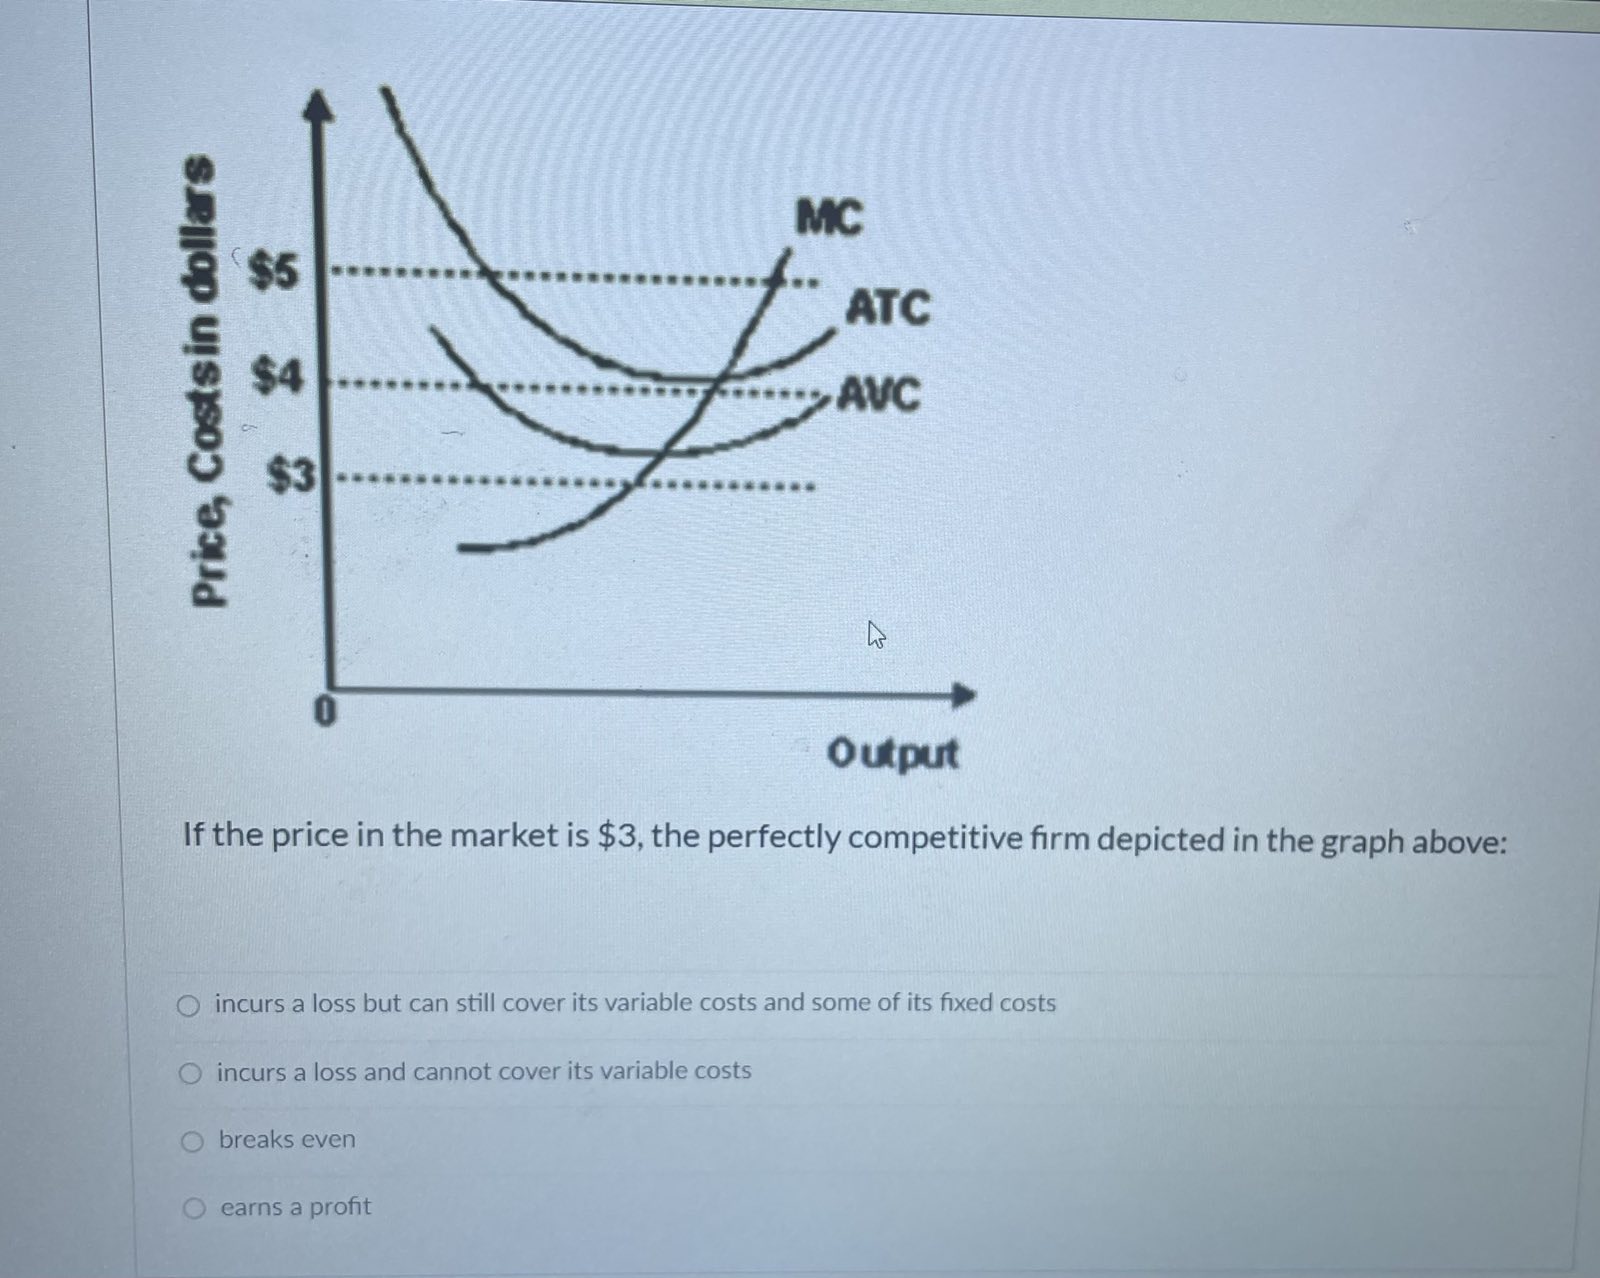
Cost, Pr MC ATC $10.0 P=MR 8.0 $7.5 $5.0 $2.5 $0.0 0 10 20 30 40 50 60 70 80 90 100 110 120 130 Quantity When maximizing profit, the perfectly competitive firm depicted in the graph will earn per-unit profit approximately equal to: O $10 O $2.5 O $2.10 O $7.5MC E ATC Price, cost AVC D A Quantity Based on the graph above a perfectly competitive firm would never continue operations in the short-run if the price dropped to which segment of the marginal cost curve? O CE O AD O CD O ACP MC MC P ATC ATC P AVC AVC P (III) Q (IV) Q Refer to the graphs above of perfectly competitive firms. Which graph(s) depict situations in which market prices will fall in the future: O Ill and IV because the firm in graph Ill will immediately shutdown and the firm in graph IV will shut down in the long run. Firms will see opportunity in the industry, which causes the market price to fall. O Ill and IV because the firms in both graphs will immediately shutdown and some firms in the industry will exit causing the price to fall. I because firms are making economic profits, which will entice firms to enter the industry and subsequently cause the market price to fall. Il because firms are making economic profits, which will entice firms to enter the market and subsequently cause prices to fall.\fOutput Total Revenue (TR) $8,000 Total Cost (TC) Total Fixed Cost (TFC) $2,800 Total Variable Cost (TVC) Average Total Cost (ATC) $12.00 Average Variable Cost (AVC) Minimum Marginal Cost (MC) Based off of the provided information answer the following 3 questions: What is the firm's average variable cost (AVC)? What is the firm's marginal cost (MC)? Should the firm decrease production or shut down in the short run? None of the available answers $8.5; $8.5; increase production $8; $8; decrease production $8.5; $8.5; shut downMC E Price, cost ATC D AVC A Quantity Based on the graph the supply curve for the perfectly competitive firm depicted is most accurately represented by the segment: O AB O CD O CE O DE450 400 350 P=MR 300 B ATC 250 AVC 200 150 100 50 0 1 2 3 4 5 6 7 8 9 10 11 12 Quantity What area in the graph above represents total economic profits for the firm? O DAFM CBWT O DABC O MFWTMC Price, Costsin dollars Output At a market price of $4, the perfectly competitive firm depicted in the graph should: O shut down immediately continue to produce in the short run but shut down in the long run continue to produce in both the short run and the long run shut down in the short run but continue production in the long runATC ATC P AVC AVC P (Ill) Q (IV) Q Refer to the graphs above of perfectly competitive firms. Which graph(s) depict situations in which market prices will rise in the future: O ll because firms are not making economic profits, which will cause firms to exit the industry and push up the market price. O III and IV because the firm in graph IV will immediately shutdown and the firm in graph Ill will shut down in the long run. Firms will exit the industry and cause the market price to rise. O Ill and IV because the firm in graph III will immediately shutdown and the firm in graph IV will shut down in the long run. Firms will exit the industry and cause the market price to rise. O Ill and IV because the firms in both graphs will immediately shutdown and some firms in the industry will exit causing price to rise\fMC LRAC ATC P=MR 8 8 6 8 8 8 Price ($ per square foot) 10 O 200 400 600 800 1000 1200 1400 Suppose that the industry continues to operate under conditions of perfect competition and that the cost curves do not shift, in the long run this perfectly competitive firm will produce: 800 units because entry from new firms will push down the market price to $50 800 units because the exiting of firms will push down the market price to $50 800 units because this is where the fixed costs are minimized 1000 units because this is where profits are maximizedrses/38527/quizzes/230052/take 70 ATC P=MR Price ($ per square foot) 8 8 8 8 8 8 0 200 400 600 800 1000 1200 1400 Suppose that the industry operates under conditions of perfect competition and that the firms in that industry seek to maximize profits, the hypothetical firm in the graph will: O produce 1,200 units in the short run O incur economic losses in the short runMC Price, Costsin dollars ts $3 .... Output If the price in the market is $3, the perfectly competitive firm depicted in the graph above: er O incurs a loss but can still cover its variable costs and some of its fixed costs. Thus it continues to operate in the short run O continues to operate in the short run, but exits the industry in the long run incurs a loss and shuts down in the short run, but continues to operate in the long run O immediately shuts down because it incurs less of a loss than if it were to continue to operate in the short runMC .. ATC Price, Costsin dollars -.... ODD..... AVC . ... Output If the price in the market is $3, the perfectly competitive firm depicted in the graph above: incurs a loss but can still cover its variable costs and some of its fixed costs incurs a loss and cannot cover its variable costs O breaks even earns a profit
Step by Step Solution
There are 3 Steps involved in it

Get step-by-step solutions from verified subject matter experts