

Question: answer as soon as possible . i will rate u!!!!like!!!! Canadian Stocks FTSE TMX FTSE TMX Long Canada Nesbitt Burns Statistics Year Canada Inflation US

answer as soon as possible . i will rate u!!!!like!!!!
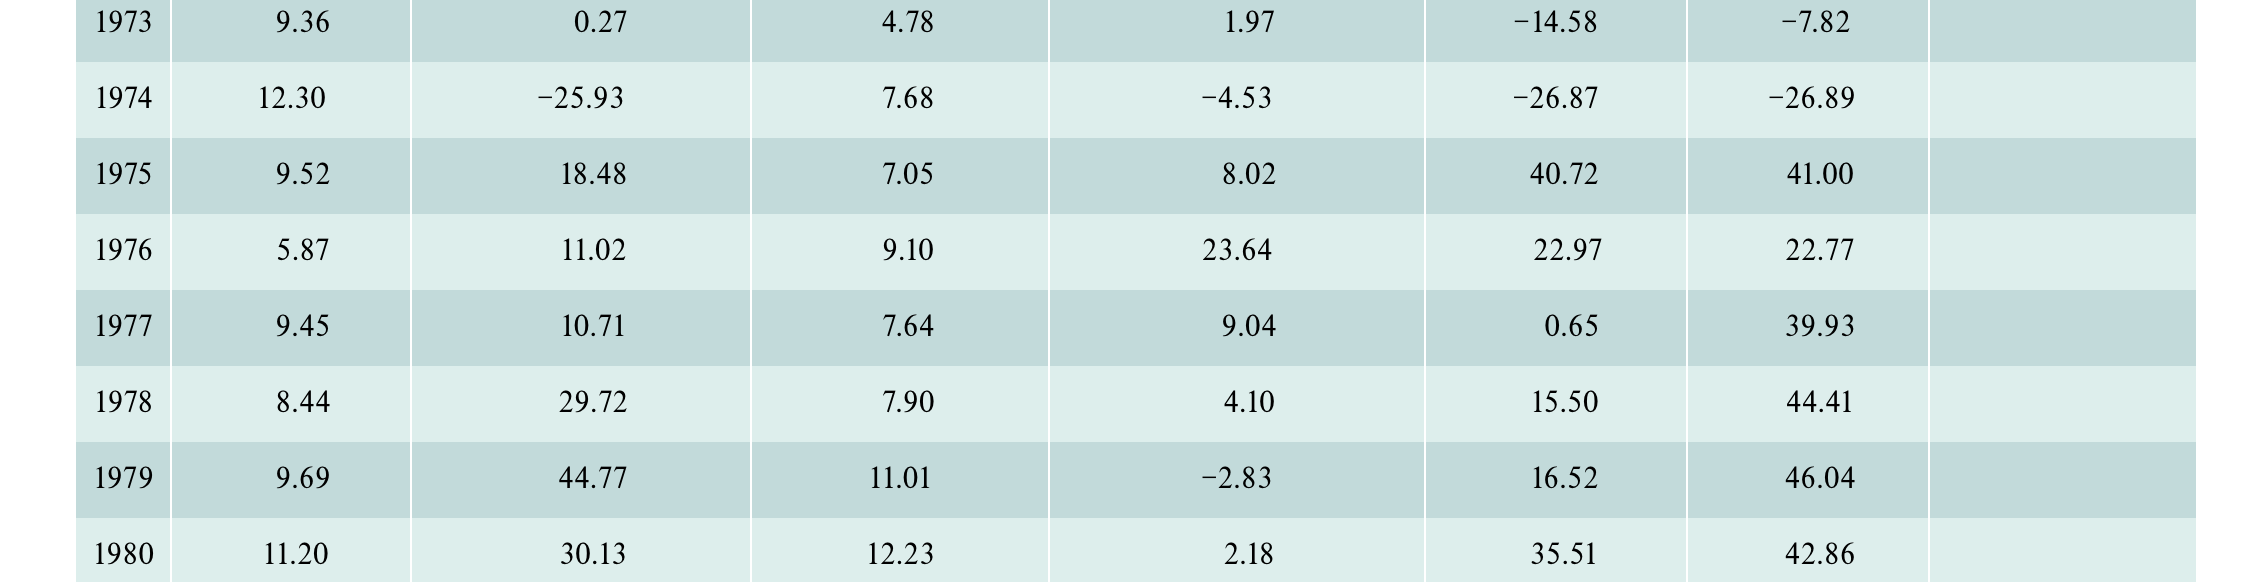
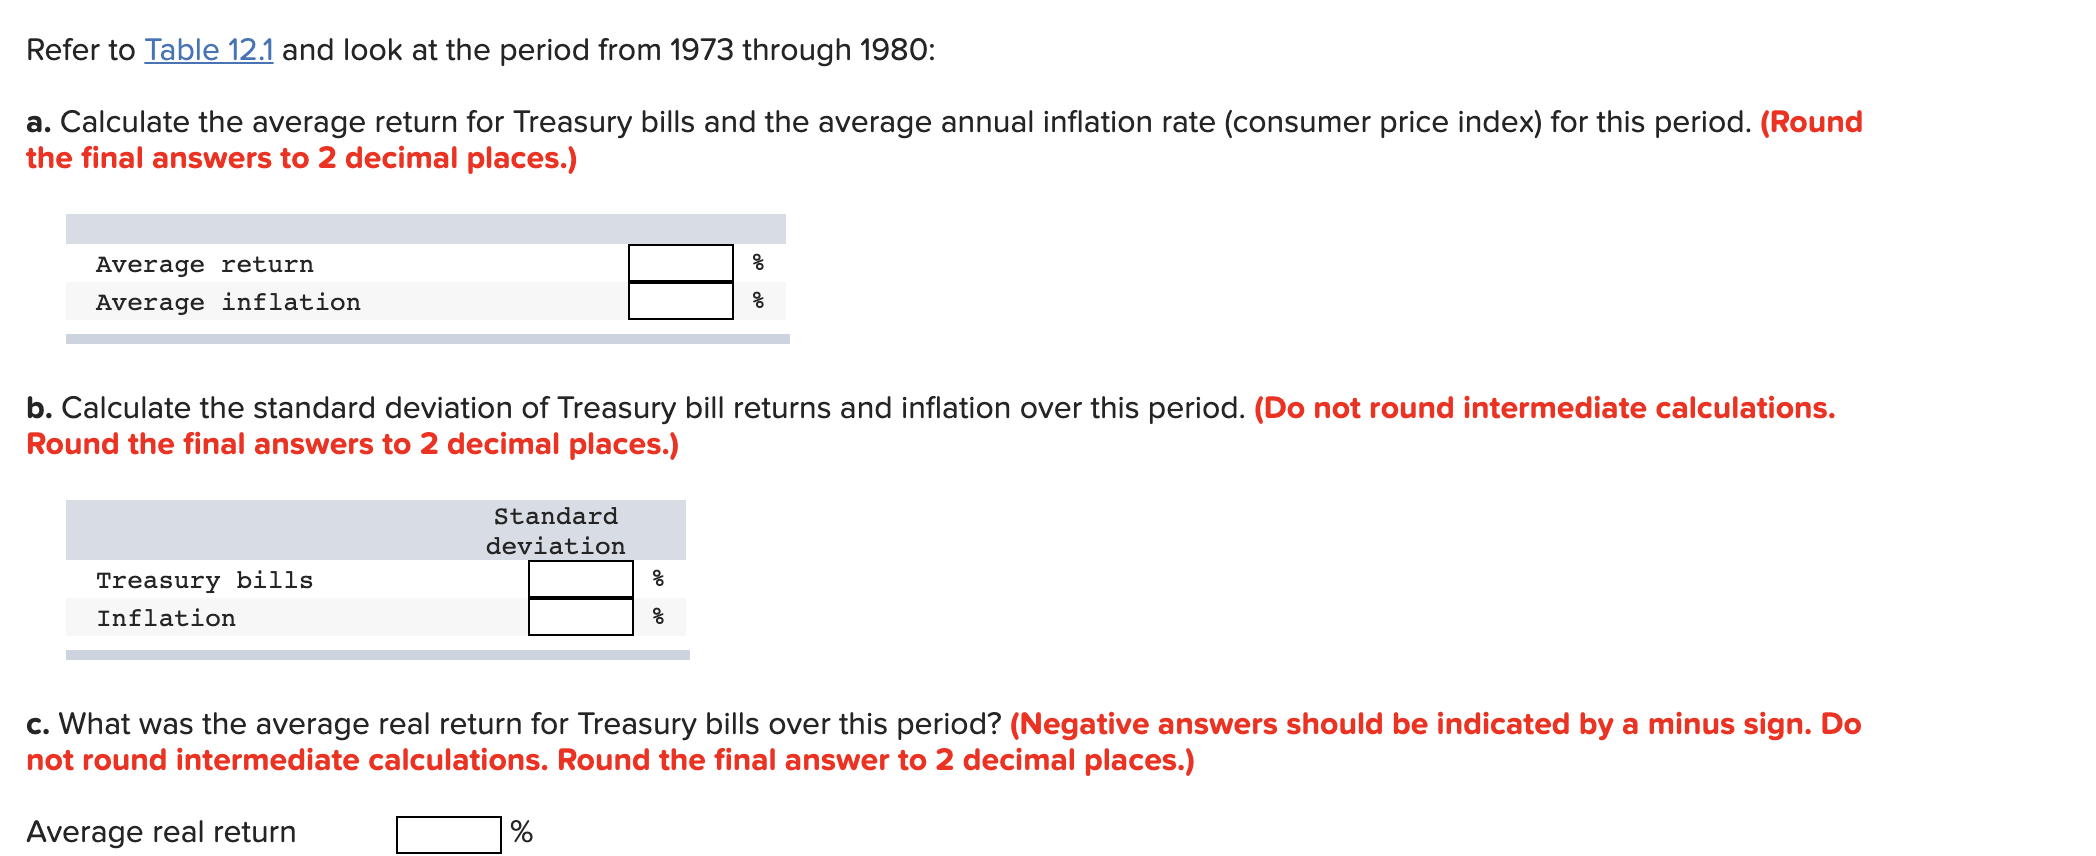
Canadian Stocks FTSE TMX FTSE TMX Long Canada Nesbitt Burns Statistics Year Canada Inflation US stocks S&P 500 (Cdn. $) S&P/TSX Venture Composite ** S&P/TSX Composite Canada 91-day T-bill long-term bond small stocks 1973 9.36 0.27 4.78 1.97 - 14.58 -7.82 1974 12.30 -25.93 7.68 -4.53 -26.87 -26.89 1975 9.52 18.48 7.05 8.02 40.72 41.00 1976 5.87 11.02 9.10 23.64 22.97 22.77 1977 9.45 10.71 7.64 9.04 0.65 39.93 1978 8.44 29.72 7.90 4.10 15.50 44.41 1979 9.69 44.77 11.01 -2.83 16.52 46.04 1980 11.20 30.13 12.23 2.18 35.51 42.86 Refer to Table 12.1 and look at the period from 1973 through 1980: a. Calculate the average return for Treasury bills and the average annual inflation rate (consumer price index) for this period. (Round the final answers to 2 decimal places.) % Average return Average inflation b. Calculate the standard deviation of Treasury bill returns and inflation over this period. (Do not round intermediate calculations. Round the final answers to 2 decimal places.) Standard deviation % Treasury bills Inflation % c. What was the average real return for Treasury bills over this period? (Negative answers should be indicated by a minus sign. Do not round intermediate calculations. Round the final answer to 2 decimal places.) Average real return % Canadian Stocks FTSE TMX FTSE TMX Long Canada Nesbitt Burns Statistics Year Canada Inflation US stocks S&P 500 (Cdn. $) S&P/TSX Venture Composite ** S&P/TSX Composite Canada 91-day T-bill long-term bond small stocks 1973 9.36 0.27 4.78 1.97 - 14.58 -7.82 1974 12.30 -25.93 7.68 -4.53 -26.87 -26.89 1975 9.52 18.48 7.05 8.02 40.72 41.00 1976 5.87 11.02 9.10 23.64 22.97 22.77 1977 9.45 10.71 7.64 9.04 0.65 39.93 1978 8.44 29.72 7.90 4.10 15.50 44.41 1979 9.69 44.77 11.01 -2.83 16.52 46.04 1980 11.20 30.13 12.23 2.18 35.51 42.86 Refer to Table 12.1 and look at the period from 1973 through 1980: a. Calculate the average return for Treasury bills and the average annual inflation rate (consumer price index) for this period. (Round the final answers to 2 decimal places.) % Average return Average inflation b. Calculate the standard deviation of Treasury bill returns and inflation over this period. (Do not round intermediate calculations. Round the final answers to 2 decimal places.) Standard deviation % Treasury bills Inflation % c. What was the average real return for Treasury bills over this period? (Negative answers should be indicated by a minus sign. Do not round intermediate calculations. Round the final answer to 2 decimal places.) Average real return %
Step by Step Solution
There are 3 Steps involved in it

Get step-by-step solutions from verified subject matter experts