

Question: answer asap plz for the empty bar requirement 5 WL P6-62A (similar to) Question Help Riley Donaldson is the Chief Operating Officer at Top Hospital
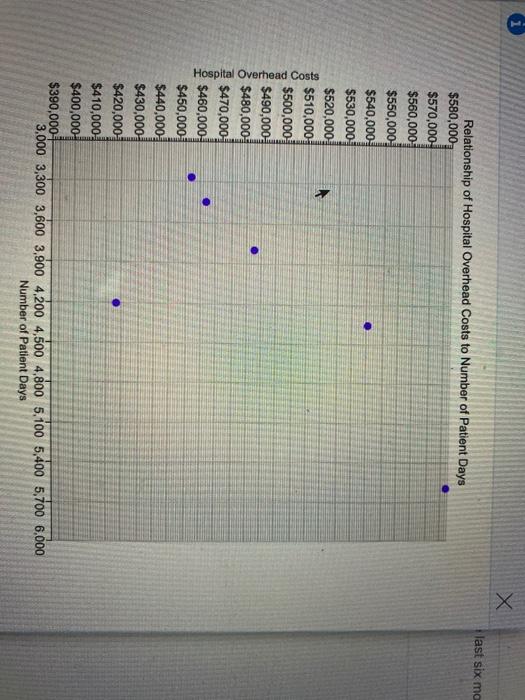
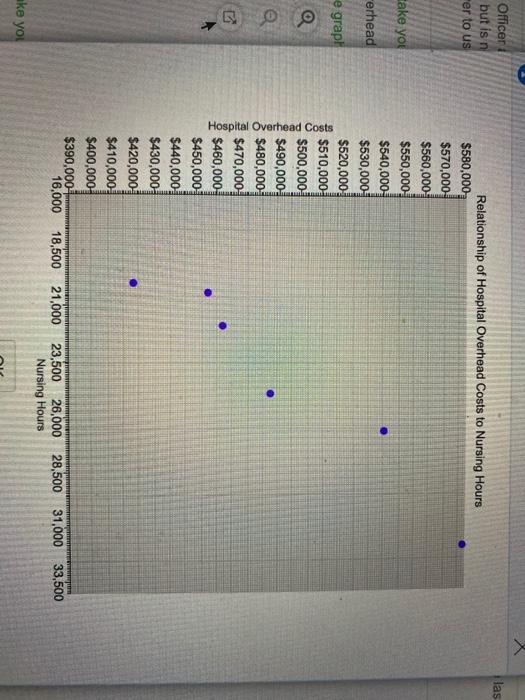
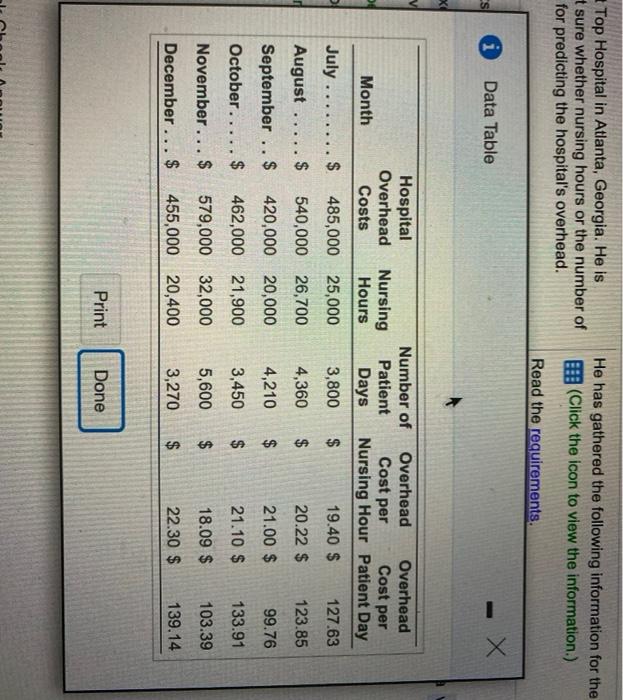
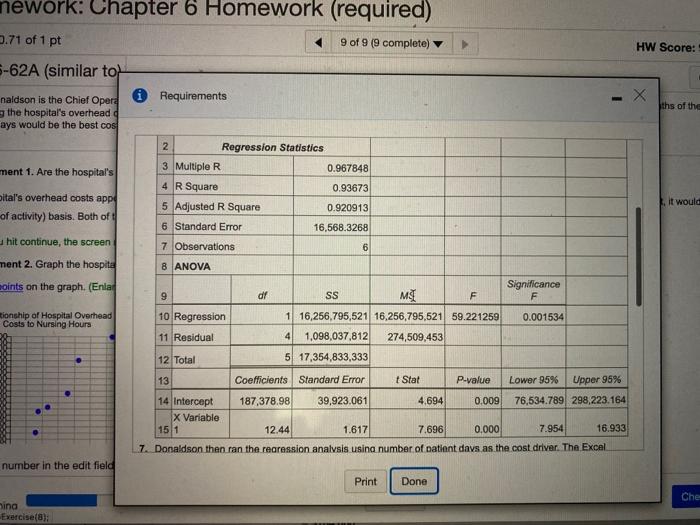
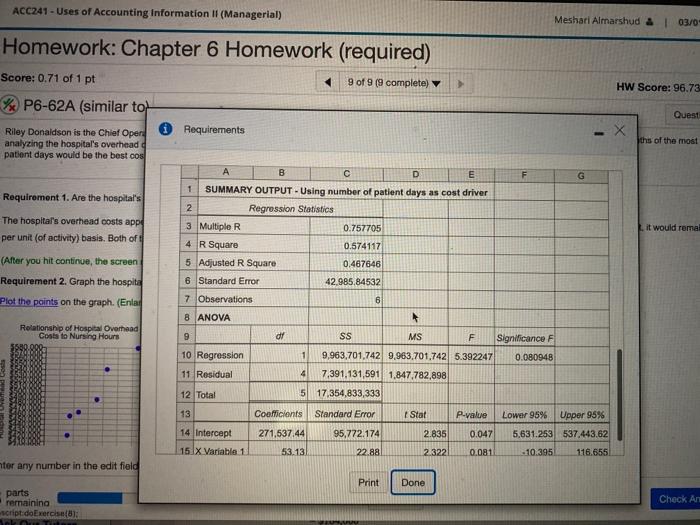
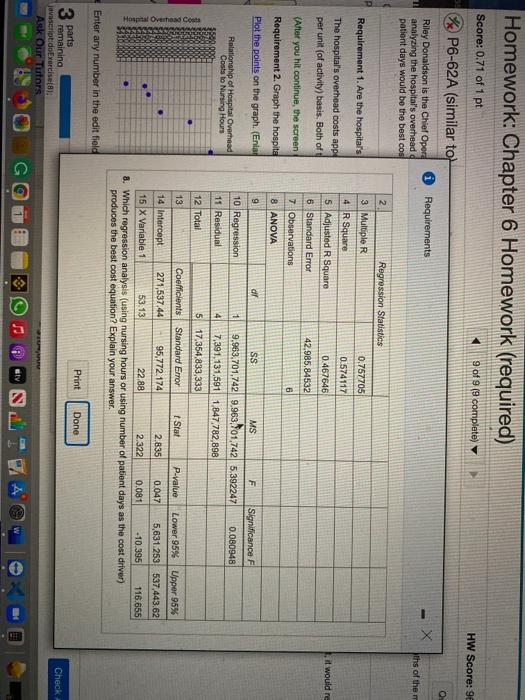
WL P6-62A (similar to) Question Help Riley Donaldson is the Chief Operating Officer at Top Hospital in Atlanta, Georgia. He is Manalyzing the hospitals overhead costs but is not sure whether nursing hours or the number of patient days would be the best cost driver to use for predicting the hospitals overhead He has gathered the following information for the last months of the most recent year (Click the icon to view the information) Read the requirements 02- 011 ED Sooraporaal Nurder of Patient Days -- ION check into this Requirement 4. Do the data appear to be sound, or do you see any potential data problems? Explain There does not appear to be any outlier in the graph depicting overhead costs against nursing hours. In the graph of overhead costs against the number of patient days, there does appear to be an outler. The September data point appears out of line with the other data points. If any of the data points are out of line, mariagement should data before continuing with the analysis. Requirements. Use the high-low method to determine the hospital's cost equation using nursing hours as the cont driver Predict total overhead costs ir 26,500 nursing hours are predicted for the month Use the high-low method to determine the hospitals cost equation using nursing hours as the cost driver. (Round the variable cost to the nearest cent.) 5 13:26 *+ $ 155,000 Predict total overhead costs If 26.500 nursing hours are predicted for the month. The total predicted overhead costs for the month is Enter any number in the edit fields and then click Check Answer 3 parts Clear All Check Answer rudexercise Ask Our Tutors y X last six mo Hospital Overhead Costs . Relationship of Hospital Overhead Costs to Number of Patient Days $580,000 $570,000 $560,000 $550,000 $540,000 $530,000 $520,000 $510,000 $500,000 $490,000 $480,000 $470,000 $460,000 $450,000 $440,000 $430,000 $420,000 $410,000 $400,000 $390,000 3,000 3,300 3,600 3,900 4,200 4,500 4.800 5.100 5,400 5,700 6,000 Number of Patient Days las Officer but is n her to us take yot erhead e graph Hospital Overhead Costs Relationship of Hospital Overhead Costs to Nursing Hours $580,000 $570,000 $560,000 $550,000 $540,000 $530,000 $520,000 $510,000 $500,000 $490,000 $480,000 $470,000 $460,000 $450,000 $440,000 $430,000 $420,000 $410,000 $400,000 $390,000 16,000 18,500 21,000 23,500 26,000 28,500 31,000 33,500 Nursing Hours ake yol Top Hospital in Atlanta, Georgia. He is t sure whether nursing hours or the number of for predicting the hospital's overhead. He has gathered the following information for the (Click the icon to view the information.) Read the requirements. ci Data Table Hospital Overhead Costs Cost per Cost per Month Nursing Hours Number of Overhead Overhead Patient Days Nursing Hour Patient Day 3,800 $ 19.40 $ 127.63 4,360 $ 20.22 $ 123.85 4,210 $ 21.00 $ 99.76 July ........$ August ..... $ September ..$ October. . . . . $ November... $ December ... $ 485,000 25,000 540,000 26,700 420,000 20,000 462,000 21,900 579,000 32,000 455,000 20,400 3,450 21.10 $ 133.91 5,600 18.09 $ 103.39 3,270 $ 22.30 $ 139.14 Print Done HW Score: 1 ths of the nework: Chapter 6 Homework (required) 5.71 of 1 pt 9 of 9 (9 complete) 5-62A (similar to naldson is the Chief Opera i Requirements the hospital's overhead ays would be the best cos 2 Regression Statistics 3 Multiple R ment 1. Are the hospital's 0.967848 4 R Square 0.93673 bital's overhead costs app 5 Adjusted R Square 0.920913 of activity) basis. Both of 6 Standard Error 16,568.3268 hit continue, the screen 7 Observations 6 ment 2. Graph the hospital 8 ANOVA oints on the graph. (Enla 9 dr SS MSI F tionship of Hospital Overhead 10 Regression 1 16,256,795,521 16,256,795,521 59.221259 Costs to Nursing Hours 11 Residual 1,098,037,812 274,509,453 12 Total 5 17,354,833,333 it would Significance F 0.001534 4 13 Coefficients Standard Error Stat p-value Lower 95% Upper 95% 14 Intercept 187,378.98 39,923.061 4,694 0.009 76,534.789 298,223.164 X Variable 151 12.44 1.617 7.696 0.000 7.954 16.933 7. Donaldson then ran the regression analysis using number of patient days as the cost driver. The Excel number in the edit field Print Done Che ina Exercise (8) ACC241 - Uses of Accounting Information If (Managerial) Meshari Almarshud & [ 03/0 Homework: Chapter 6 Homework (required) Score: 0.71 of 1 pt 9 of 9 (9 complete) HW Score: 96.73 Quest X ths of the most G it would remai % P6-62A (similar to Riley Donaldson is the Chief Oper * Requirements analyzing the hospital's overhead patient days would be the best cos B D E 1 SUMMARY OUTPUT - Using number of patient days as cost driver Requirement 1. Are the hospital's 2 Regression Statistics The hospital's overhead costs app 3 Multiple R 0.757705 per unit (of activity) basis. Both of 4 R Square 0.574117 (After you hit continue the screen 5 Adjusted R Square 0.467646 Requirement 2. Graph the hospita 6 Standard Error 42,985,84532 Plot the points on the graph. (Enlar 7 Observations 6 8 ANOVA Relationship of Hospital Overhead Costs to Nursing Hours 9 dr SS MS F Significance F 10 Regression 1 9,963,701,742 9.963,701,742 5.392247 0.080948 11. Residual 4 7,391,131,591 1,847,782,898 12 Total 517 354,833,333 13 Coefficients Standard Error Stat P-value 2.835 0.047 14 Intercept 15 X Variable 1 271,537.44 53.13 95,772.174 22.88 Lower 95% Upper 95% 5,631.253 537.443.62 -10.395 116.655 2.322 0.081 ter any number in the edit field Print Done parts rernaining script.doExercise (8): Check An Homework: Chapter 6 Homework (required) Score: 0.71 of 1 pt 9 of 9 (9 complete) HW Score: 9 P6-62A (similar to O Requirements Riley Donaldson is the Chief Opera analyzing the hospital's overhead patient days would be the best cos ths of them Requirement 1. Are the hospital's The hospital's overhead costs app per unit (of activity) basis. Both of it would re (After you hit continue the screen Requirement 2. Graph the hospita Plot the points on the graph. (Enlar 2 Regression Statistics 3 Multiple R 0.757705 4 R Square 0.574117 5 Adjusted R Square 0.467646 6 Standard Error 42.985.84532 7. Observations 6 8 ANOVA 9 dr SS MS F Significance F 10 Regression 1 9,963,701,742 9,963,701,742 5.392247 0.080948 11 Residual 4 7,391,131,591 1,847,782,898 12 Total 5 17,354,833,333 Relationship of Hospital Overhead Costs to Nursing Hours Hospital Overhead Costs 13 Coefficients Standard Error Stat P-value Lower 95% Upper 95% 14 Intercept 271,537.44 95.772.174 2.835 0.047 5,631.253 537,443.62 15 X Variable 1 53.13 22.88 2.322 0.081 -10.395 116.655 8. Which regression analysis (using nursing hours or using number of patient days as the cost driver) produces the best cost equation? Explain your answer. Enter any number in the edit field Print Done Done 3 parts remaining javascript.doExercise (8) Ask Our Tutors Check WL P6-62A (similar to) Question Help Riley Donaldson is the Chief Operating Officer at Top Hospital in Atlanta, Georgia. He is Manalyzing the hospitals overhead costs but is not sure whether nursing hours or the number of patient days would be the best cost driver to use for predicting the hospitals overhead He has gathered the following information for the last months of the most recent year (Click the icon to view the information) Read the requirements 02- 011 ED Sooraporaal Nurder of Patient Days -- ION check into this Requirement 4. Do the data appear to be sound, or do you see any potential data problems? Explain There does not appear to be any outlier in the graph depicting overhead costs against nursing hours. In the graph of overhead costs against the number of patient days, there does appear to be an outler. The September data point appears out of line with the other data points. If any of the data points are out of line, mariagement should data before continuing with the analysis. Requirements. Use the high-low method to determine the hospital's cost equation using nursing hours as the cont driver Predict total overhead costs ir 26,500 nursing hours are predicted for the month Use the high-low method to determine the hospitals cost equation using nursing hours as the cost driver. (Round the variable cost to the nearest cent.) 5 13:26 *+ $ 155,000 Predict total overhead costs If 26.500 nursing hours are predicted for the month. The total predicted overhead costs for the month is Enter any number in the edit fields and then click Check Answer 3 parts Clear All Check Answer rudexercise Ask Our Tutors y X last six mo Hospital Overhead Costs . Relationship of Hospital Overhead Costs to Number of Patient Days $580,000 $570,000 $560,000 $550,000 $540,000 $530,000 $520,000 $510,000 $500,000 $490,000 $480,000 $470,000 $460,000 $450,000 $440,000 $430,000 $420,000 $410,000 $400,000 $390,000 3,000 3,300 3,600 3,900 4,200 4,500 4.800 5.100 5,400 5,700 6,000 Number of Patient Days las Officer but is n her to us take yot erhead e graph Hospital Overhead Costs Relationship of Hospital Overhead Costs to Nursing Hours $580,000 $570,000 $560,000 $550,000 $540,000 $530,000 $520,000 $510,000 $500,000 $490,000 $480,000 $470,000 $460,000 $450,000 $440,000 $430,000 $420,000 $410,000 $400,000 $390,000 16,000 18,500 21,000 23,500 26,000 28,500 31,000 33,500 Nursing Hours ake yol Top Hospital in Atlanta, Georgia. He is t sure whether nursing hours or the number of for predicting the hospital's overhead. He has gathered the following information for the (Click the icon to view the information.) Read the requirements. ci Data Table Hospital Overhead Costs Cost per Cost per Month Nursing Hours Number of Overhead Overhead Patient Days Nursing Hour Patient Day 3,800 $ 19.40 $ 127.63 4,360 $ 20.22 $ 123.85 4,210 $ 21.00 $ 99.76 July ........$ August ..... $ September ..$ October. . . . . $ November... $ December ... $ 485,000 25,000 540,000 26,700 420,000 20,000 462,000 21,900 579,000 32,000 455,000 20,400 3,450 21.10 $ 133.91 5,600 18.09 $ 103.39 3,270 $ 22.30 $ 139.14 Print Done HW Score: 1 ths of the nework: Chapter 6 Homework (required) 5.71 of 1 pt 9 of 9 (9 complete) 5-62A (similar to naldson is the Chief Opera i Requirements the hospital's overhead ays would be the best cos 2 Regression Statistics 3 Multiple R ment 1. Are the hospital's 0.967848 4 R Square 0.93673 bital's overhead costs app 5 Adjusted R Square 0.920913 of activity) basis. Both of 6 Standard Error 16,568.3268 hit continue, the screen 7 Observations 6 ment 2. Graph the hospital 8 ANOVA oints on the graph. (Enla 9 dr SS MSI F tionship of Hospital Overhead 10 Regression 1 16,256,795,521 16,256,795,521 59.221259 Costs to Nursing Hours 11 Residual 1,098,037,812 274,509,453 12 Total 5 17,354,833,333 it would Significance F 0.001534 4 13 Coefficients Standard Error Stat p-value Lower 95% Upper 95% 14 Intercept 187,378.98 39,923.061 4,694 0.009 76,534.789 298,223.164 X Variable 151 12.44 1.617 7.696 0.000 7.954 16.933 7. Donaldson then ran the regression analysis using number of patient days as the cost driver. The Excel number in the edit field Print Done Che ina Exercise (8) ACC241 - Uses of Accounting Information If (Managerial) Meshari Almarshud & [ 03/0 Homework: Chapter 6 Homework (required) Score: 0.71 of 1 pt 9 of 9 (9 complete) HW Score: 96.73 Quest X ths of the most G it would remai % P6-62A (similar to Riley Donaldson is the Chief Oper * Requirements analyzing the hospital's overhead patient days would be the best cos B D E 1 SUMMARY OUTPUT - Using number of patient days as cost driver Requirement 1. Are the hospital's 2 Regression Statistics The hospital's overhead costs app 3 Multiple R 0.757705 per unit (of activity) basis. Both of 4 R Square 0.574117 (After you hit continue the screen 5 Adjusted R Square 0.467646 Requirement 2. Graph the hospita 6 Standard Error 42,985,84532 Plot the points on the graph. (Enlar 7 Observations 6 8 ANOVA Relationship of Hospital Overhead Costs to Nursing Hours 9 dr SS MS F Significance F 10 Regression 1 9,963,701,742 9.963,701,742 5.392247 0.080948 11. Residual 4 7,391,131,591 1,847,782,898 12 Total 517 354,833,333 13 Coefficients Standard Error Stat P-value 2.835 0.047 14 Intercept 15 X Variable 1 271,537.44 53.13 95,772.174 22.88 Lower 95% Upper 95% 5,631.253 537.443.62 -10.395 116.655 2.322 0.081 ter any number in the edit field Print Done parts rernaining script.doExercise (8): Check An Homework: Chapter 6 Homework (required) Score: 0.71 of 1 pt 9 of 9 (9 complete) HW Score: 9 P6-62A (similar to O Requirements Riley Donaldson is the Chief Opera analyzing the hospital's overhead patient days would be the best cos ths of them Requirement 1. Are the hospital's The hospital's overhead costs app per unit (of activity) basis. Both of it would re (After you hit continue the screen Requirement 2. Graph the hospita Plot the points on the graph. (Enlar 2 Regression Statistics 3 Multiple R 0.757705 4 R Square 0.574117 5 Adjusted R Square 0.467646 6 Standard Error 42.985.84532 7. Observations 6 8 ANOVA 9 dr SS MS F Significance F 10 Regression 1 9,963,701,742 9,963,701,742 5.392247 0.080948 11 Residual 4 7,391,131,591 1,847,782,898 12 Total 5 17,354,833,333 Relationship of Hospital Overhead Costs to Nursing Hours Hospital Overhead Costs 13 Coefficients Standard Error Stat P-value Lower 95% Upper 95% 14 Intercept 271,537.44 95.772.174 2.835 0.047 5,631.253 537,443.62 15 X Variable 1 53.13 22.88 2.322 0.081 -10.395 116.655 8. Which regression analysis (using nursing hours or using number of patient days as the cost driver) produces the best cost equation? Explain your answer. Enter any number in the edit field Print Done Done 3 parts remaining javascript.doExercise (8) Ask Our Tutors Check
Step by Step Solution
There are 3 Steps involved in it

Get step-by-step solutions from verified subject matter experts