

Question: Answer B and C a. Insert a clear screenshot of your vehicles (5 pts.). 25 20 15 Frequency 10 13000 20000 27000 34000 41000 48000
Answer B and C
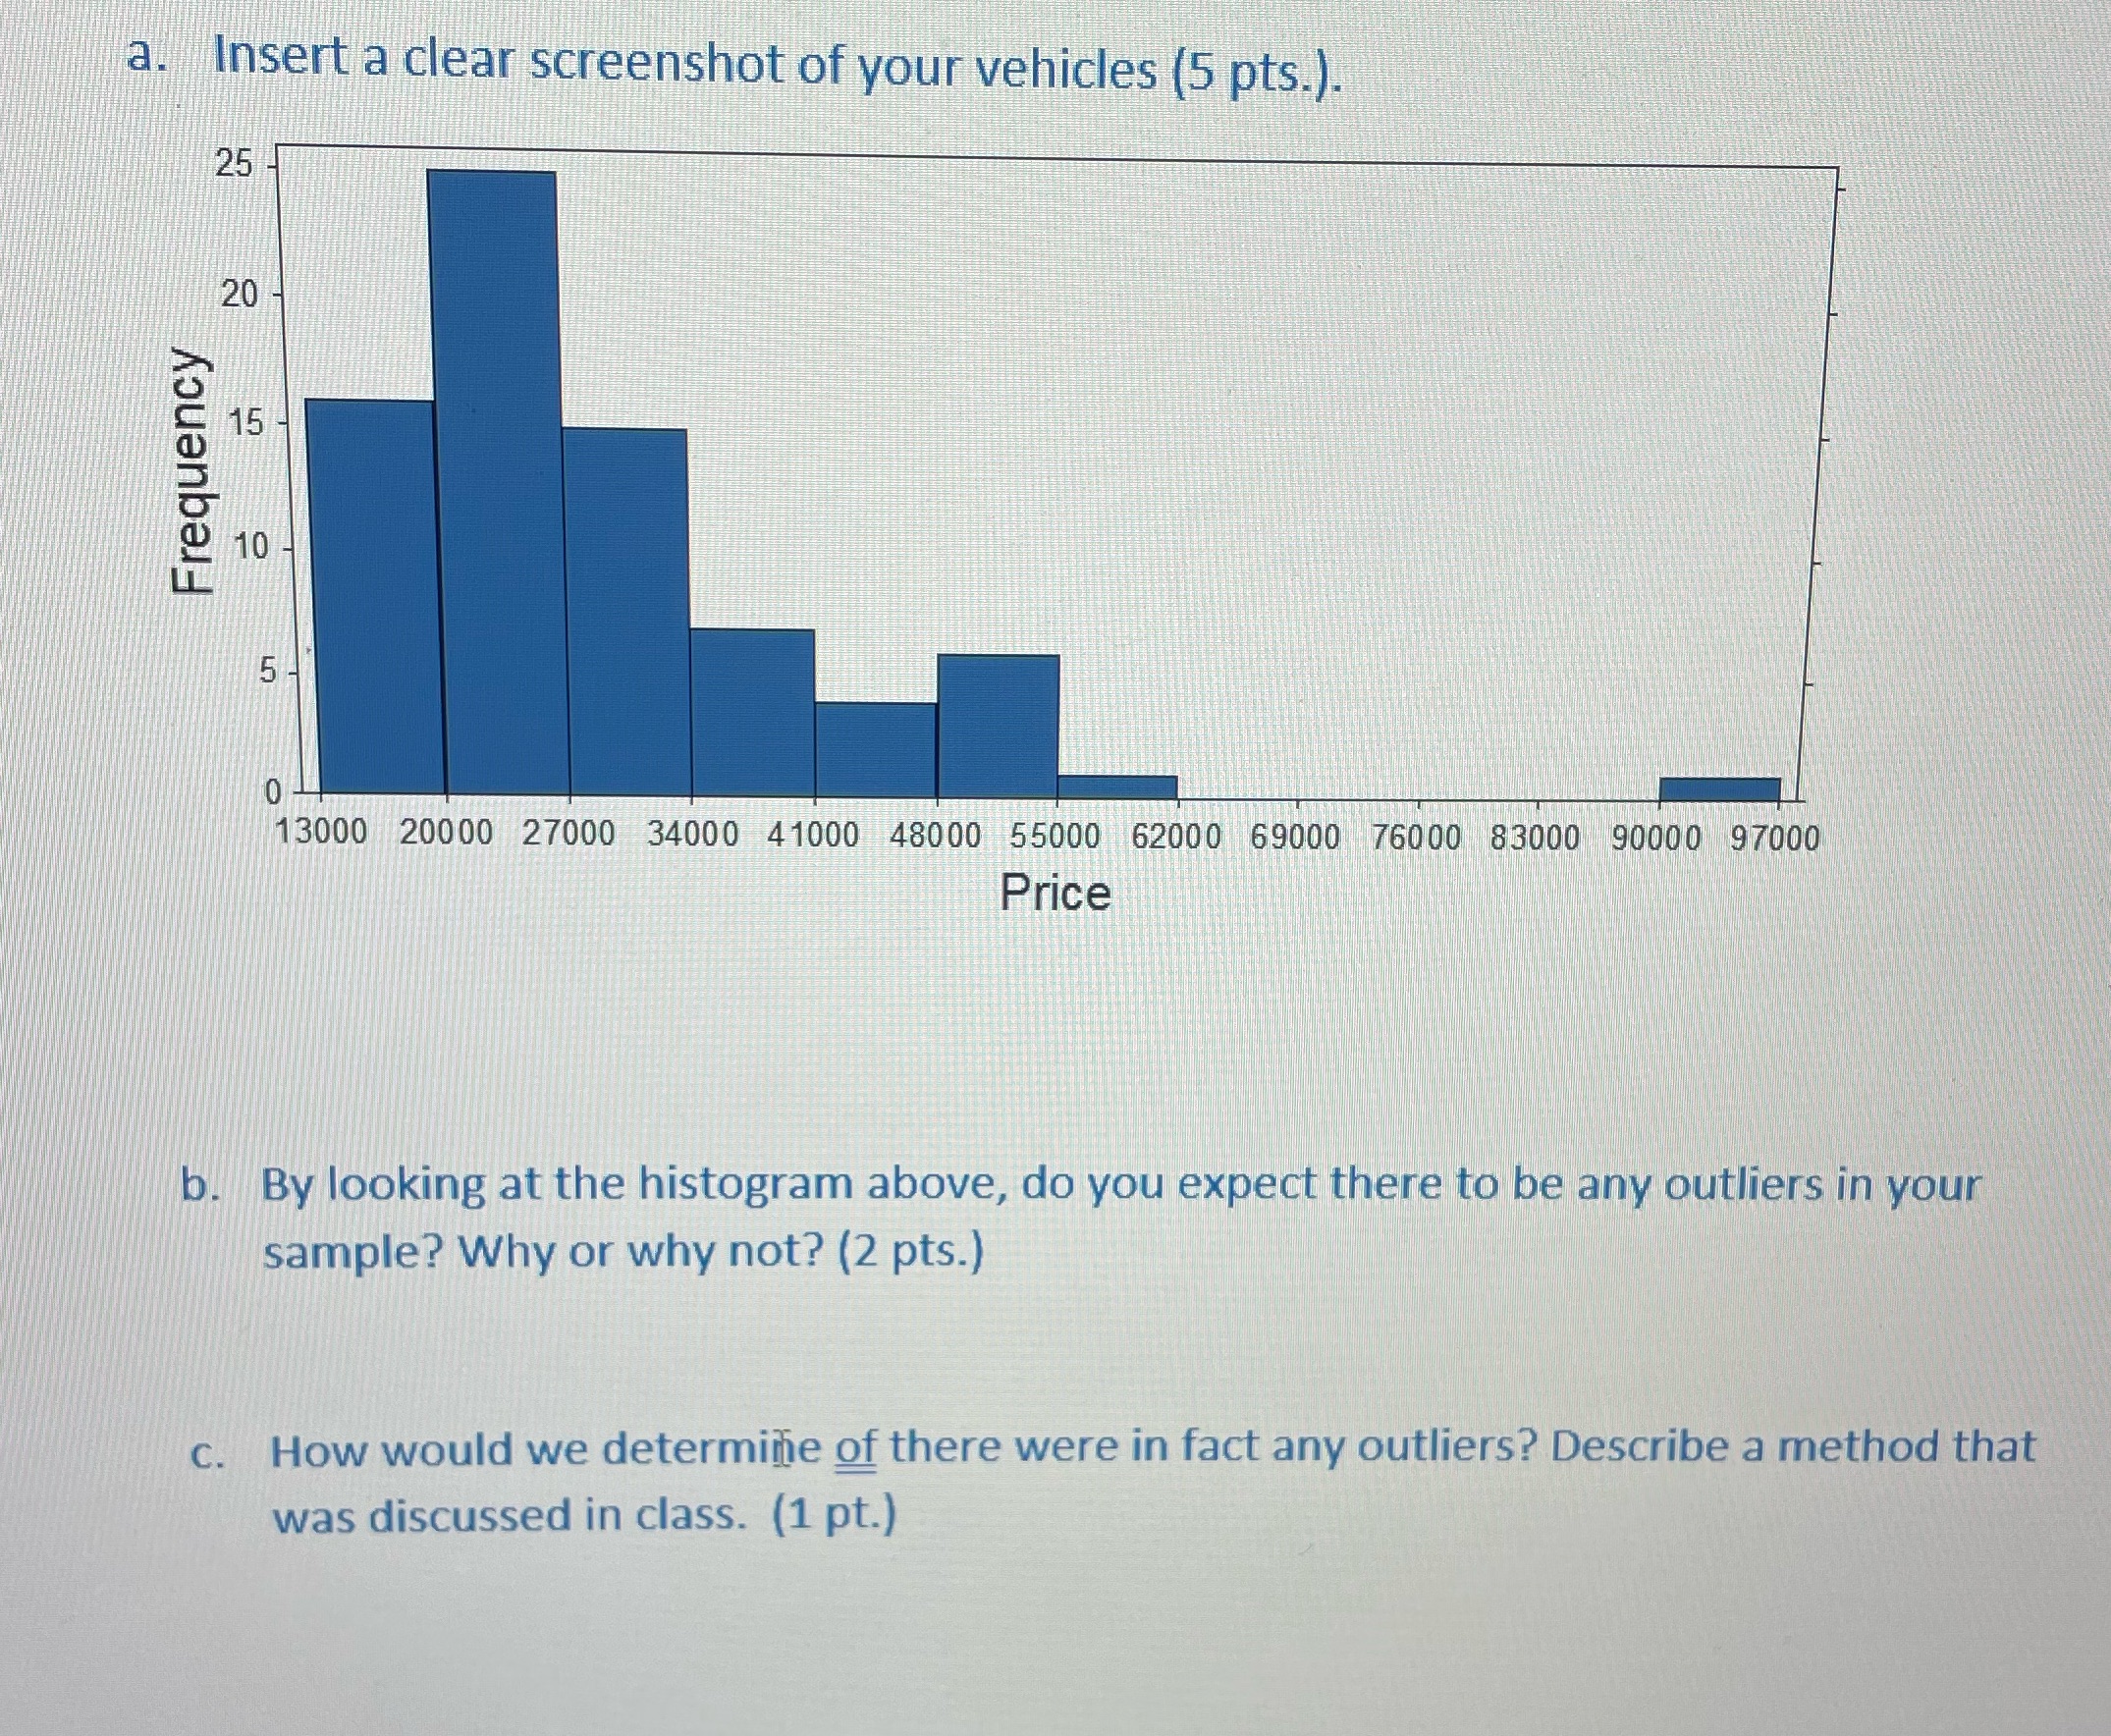
a. Insert a clear screenshot of your vehicles (5 pts.). 25 20 15 Frequency 10 13000 20000 27000 34000 41000 48000 55000 62000 69000 76000 83000 90000 97000 Price b. By looking at the histogram above, do you expect there to be any outliers in your sample? Why or why not? (2 pts.) c. How would we determine of there were in fact any outliers? Describe a method that was discussed in class. (1 pt.)
Step by Step Solution
There are 3 Steps involved in it
1 Expert Approved Answer
Step: 1 Unlock

Question Has Been Solved by an Expert!
Get step-by-step solutions from verified subject matter experts
Step: 2 Unlock
Step: 3 Unlock