

Question: Answer B and C please You may need to vie the appropriate technelegy to answer this euestion. Mitifints. (a) Develop a scatter chart for these
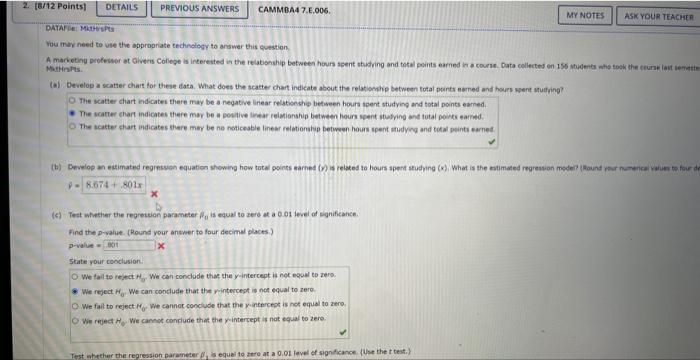
You may need to vie the appropriate technelegy to answer this euestion. Mitifints. (a) Develop a scatter chart for these data. What does the scatter chart indicate about the relatioghip betwicen total points ebrred and hours sent stucting? The scatter chart indicates there may be a negative linear relatiseship betseen hours spent studying and total points earned. The scatter chart indicates there mor be a posaive thitar relmionship betweten hours apent stothing and total poicts earred. The scater chart indicates there may be ne noticeable linear reletionship between houms spent atudying and cotal peinti earned. (c) Test whesher the regreseion parameter 0 is equal to aere at a 0.01 level of significance. Find the p-value. (Hound your anewer to four decimal places.) privalue = State your conclusion- We fail to reftct th. We can conclade that the y-intercept is not equal to zero: We reject H0. We can conclude that the yintercept is not equal to zere. We fail to reject H0. We cannok conclude that the wintercept is not equal to zero. We reject Hy. We cancet condude that the yuintercept is not equal to zero. Test whether the regression parameter p1 is equai to atro at a 0.01 level ef signdicance. (Use the t test.)
Step by Step Solution
There are 3 Steps involved in it

Get step-by-step solutions from verified subject matter experts