

Question: Answer B and C-1 Return to question Below are percentages for annual sales growth and net sales attributed to loyalty card usage at 74 Noodles
Answer B and C-1
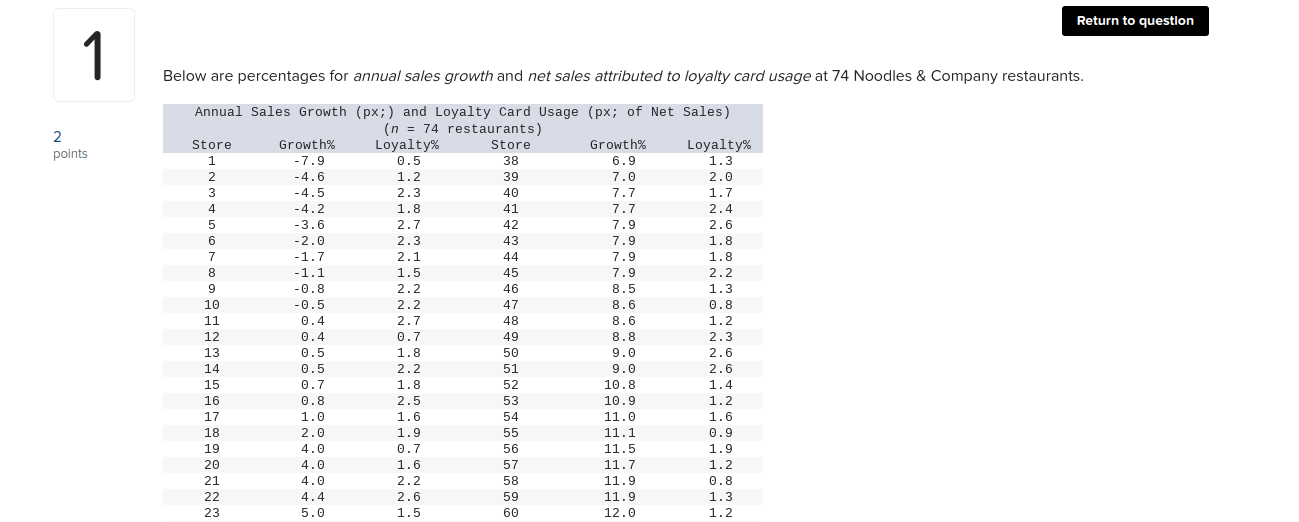
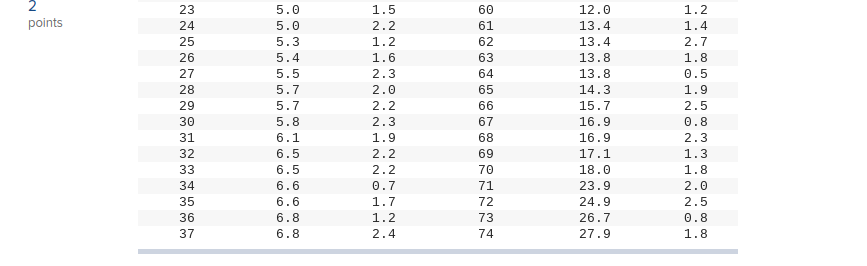
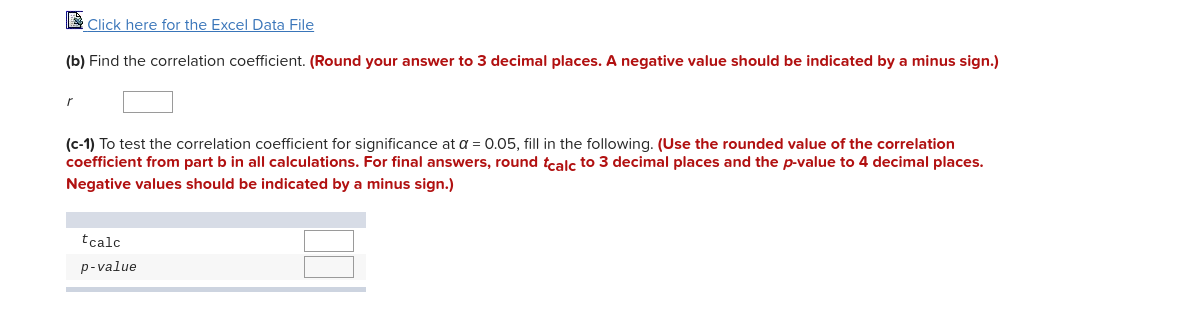
Return to question Below are percentages for annual sales growth and net sales attributed to loyalty card usage at 74 Noodles & Company restaurants. Annual Sales Growth (px; ) and Loyalty Card Usage (px; of Net Sales) 2 (n = 74 restaurants) points Store Growth% Loyalty% Store - 7.9 0. 5 Growth% 38 Loyalty% -4.6 1.2 6.9 1.3 39 -4.5 2 .3 7.0 2.0 40 7.7 -4.2 1.8 1. 7 41 -3.6 2. 7 7.7 2.4 42 -2.0 2 .3 7.9 2.6 43 -1. 7 2. 1 7.9 1.8 44 -1.1 1.5 7.9 1.8 45 -0.8 2. 2 7.9 2.2 46 - 0.5 8.5 2.2 1.3 47 11 0.4 2. 7 8.6 0.8 12 48 1.2 13 0.4 0 . 7 8.6 49 0 .5 8. 8 2.3 14 1.8 50 0.5 2. 6 15 2.2 9.0 51 0. 7 1.8 9.0 2.6 52 16 0.8 2.5 10.8 1.4 53 17 1.0 1.6 10.9 1.2 18 2.0 54 1.9 11.0 1. 6 55 19 4. 0 0. 7 11 .1 0.9 56 20 4.0 1.6 11.5 1.9 21 57 4.0 2.2 11. 7 1.2 58 22 4.4 11.9 0 .8 23 2.6 59 5.0 1.5 11.9 60 1.3 12.0 1.2\fClick here for the Excel Data File (b) Find the correlation coefficient. (Round your answer to 3 decimal places. A negative value should be indicated by a minus sign.) (c-1) To test the correlation coefficient for significance at a = 0.05, fill in the following. (Use the rounded value of the correlation coefficient from part b in all calculations. For final answers, round tcalc to 3 decimal places and the p-value to 4 decimal places. Negative values should be indicated by a minus sign.) tcalc p-value
Step by Step Solution
There are 3 Steps involved in it

Get step-by-step solutions from verified subject matter experts