

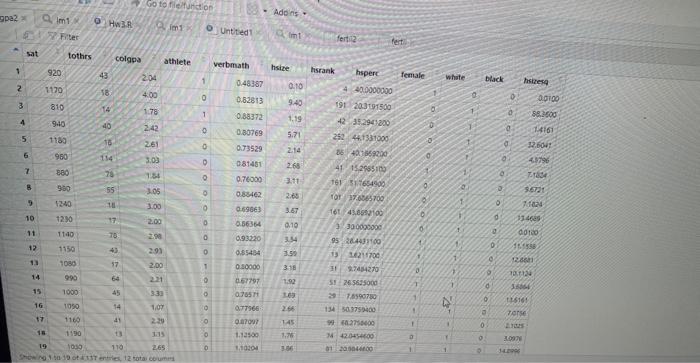
Question: answer b that is what the data looks like. i cant upload the data, can u just show the R code thats supposed to work
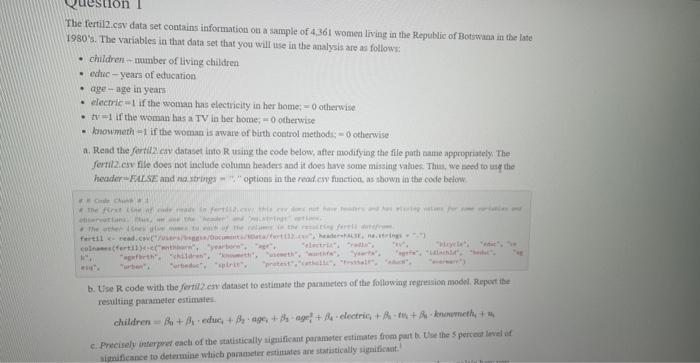
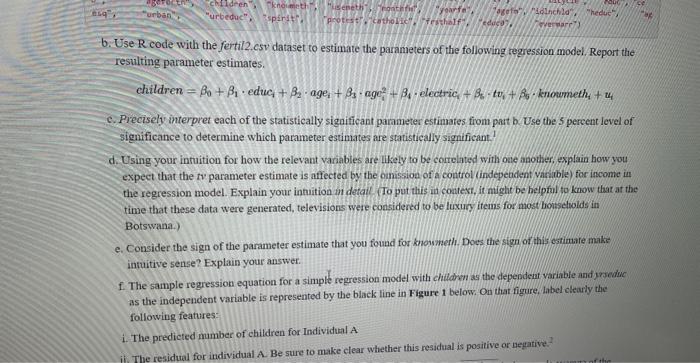
The fertil2. csv data set contains information on a sample of 4,361 women living in the Repullic of Botswaas in the late 1980 : The variables in that data set that you will use in the analysis are as follows: - children - number of living children - eulic-years of education - age-age in years - electric =1 if the woman has electriciry in her home; =0 otherwise - tv=1 if the woman has a TV in ber bome;-0 otberwise - krowmeth - 1 if the woman is aware of birth control thethods; =0 otherwise a. Read the fortiz eav dataset lino R using the code below, after modifying the file path aame approgriately the header -EALSE and na strings = " " "options in the rad en function, as stown in the code below. rist. b. Lise R code with the fertil2 erv dataset to estimate the parameters of the following regrelsion model. Report ibe resulting panameter estimate-. children=0+1educi+2gc1+1age12+4deceric+2t1+1lonanneth4+u4 significance to determine which panameter extimates ane statizically rignificaat.' b. Use R code with the fertil2.csv dataset to estimate the parameters of the following regression model. Report the resulting parameter estimates. children=0+1educi+2agei+3agci2+4electric+6tvi+0knowmethi+ui c. Precisely interpret each of the statistically sigaificant parameter estimates fiom part b. Use the 5 percent level of significance to determine which parameter estimates are statistically significant. d. Using your intuition for how the relevant variables are Iikely to be correlited with one another, explain how you expect that the fv parameter estimate is affected by the omission of a control (independent varibble) for income in the regression model. Explain your intuition in detail (Jo put thifs in coatest, it might be helptil to know that at the time that these data were generated, televisions were considered to be lixury itens for most hotseholds in Botstwana.) e. Consider the sign of the parameter estimate that you found for know weth. Does the sign of this estimare make inruitive sense? Explain your answer. f. The sample regression equation for a simple regression model with chitlden as the dependeat variable and yrseduc as the independent variable is represented by the black line in Figure 1 below. On that figure, Ihbel clearly the following features: 1. The predicted mumber of children for Individual A ii. The residual for individual A. Be sure to make clear whether this residual is positive or negative
Step by Step Solution
There are 3 Steps involved in it

Get step-by-step solutions from verified subject matter experts