

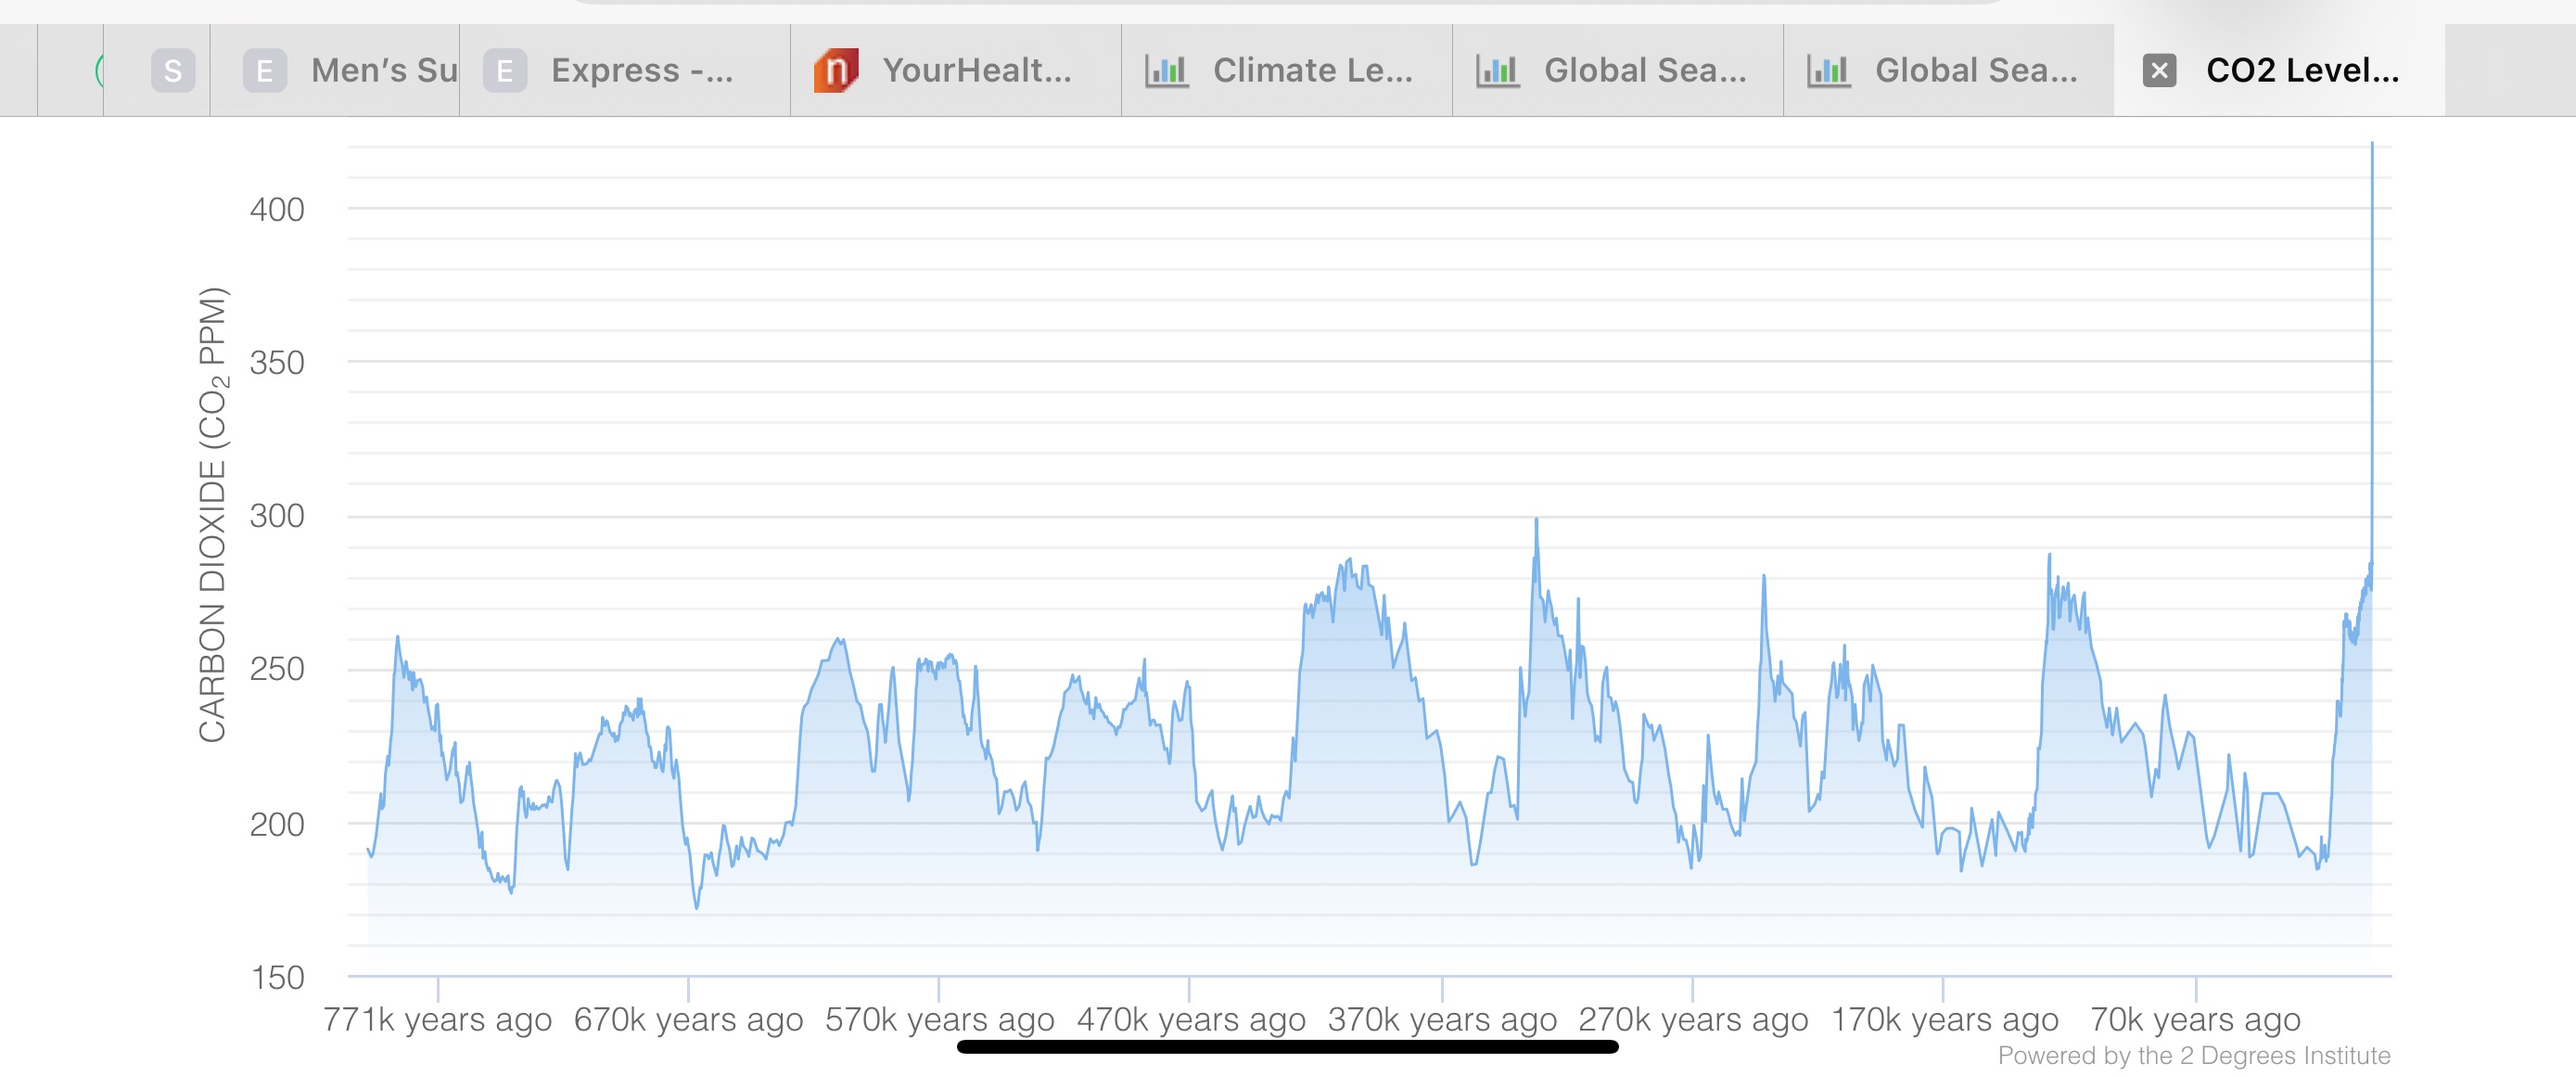
Question: Answer based on the co2 level for the past 800,000 years ago What are the highest and lowest concentrations shown on the graph? When were
Answer based on the co2 level for the past 800,000 years ago What are the highest and lowest concentrations shown on the graph? When were they and how much were they?2. How do they compare to present day CO2 levels?3. How do these high and low concentrations compare to mean global temperature? To make this connection click on the globe and thermometer icon in the upper right.4. Are there any instances where peaks in CO2 happen before peaks in temperature? Are there any instances where the peaks in CO2 happen after temperature peaks?5. Are there any instances where lows in CO2 happen before lows in temperature? Are there any instances where the lows in CO2 happen after temperature lows?6. Over the past 800,000 years temperature seemed to go from extreme highs to extreme lows (for instance 126,000 to 22,100 years ago) on a regular basis. Look back at the other cycles like this identified in questions 5 and 6 in Activity A. What is the length of these other cycles? What is the average of all the cycles?7. Referring back to question 7 in part A what seems to be the average time between interglacials in a cycle?8. The earth's orbit changes from a circle to an ellipse and back to a circle every 100,000 to 413,000 years. The tilt of its axis changes from 22 to 24 every 41,000 years. How do these changes compare to in orbit and tilt compare to the length of the cycles outlined in question 6? How do they compare to the average time between interglacials?.https://www.co2levels.org/?theme=grid-light&pid=2degreesinstitute
Step by Step Solution
There are 3 Steps involved in it

Get step-by-step solutions from verified subject matter experts