

Question: Answer below questions base on the decision tree below graph Based on your Decision Tree, list the characteristics of students who are most likely to
- Answer below questions base on the decision tree below graph
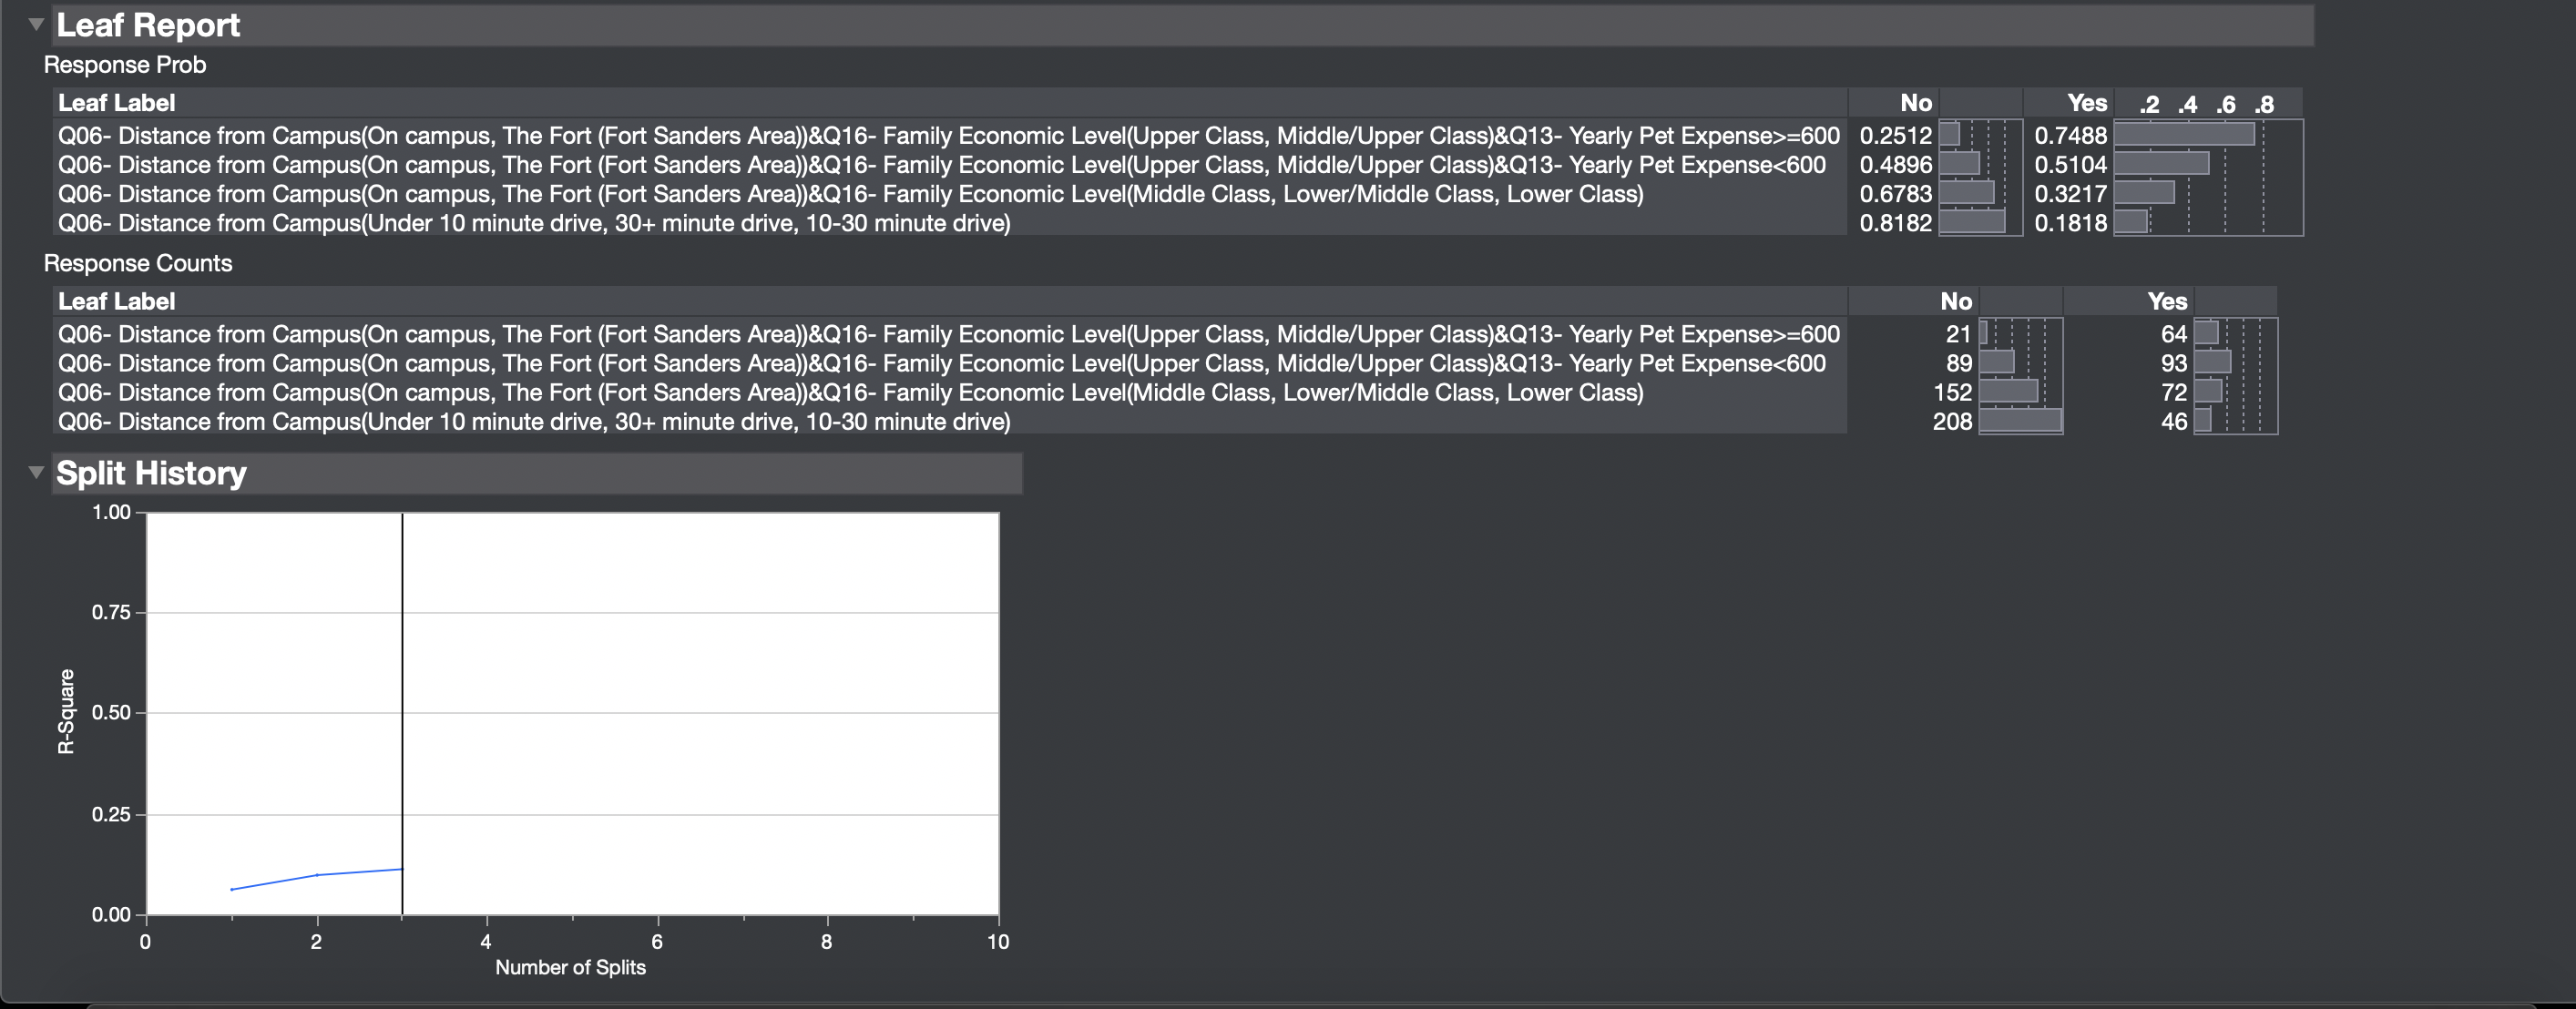
- Based on your Decision Tree, list the characteristics of students who are most likely to be in a Fraternity and Sorority. Include the number of students in that group and the probability.
- Based on your Decision Tree, list the characteristics of students who are least likely to be in a Fraternity and Sorority. Include the number of students in that group and the probability.
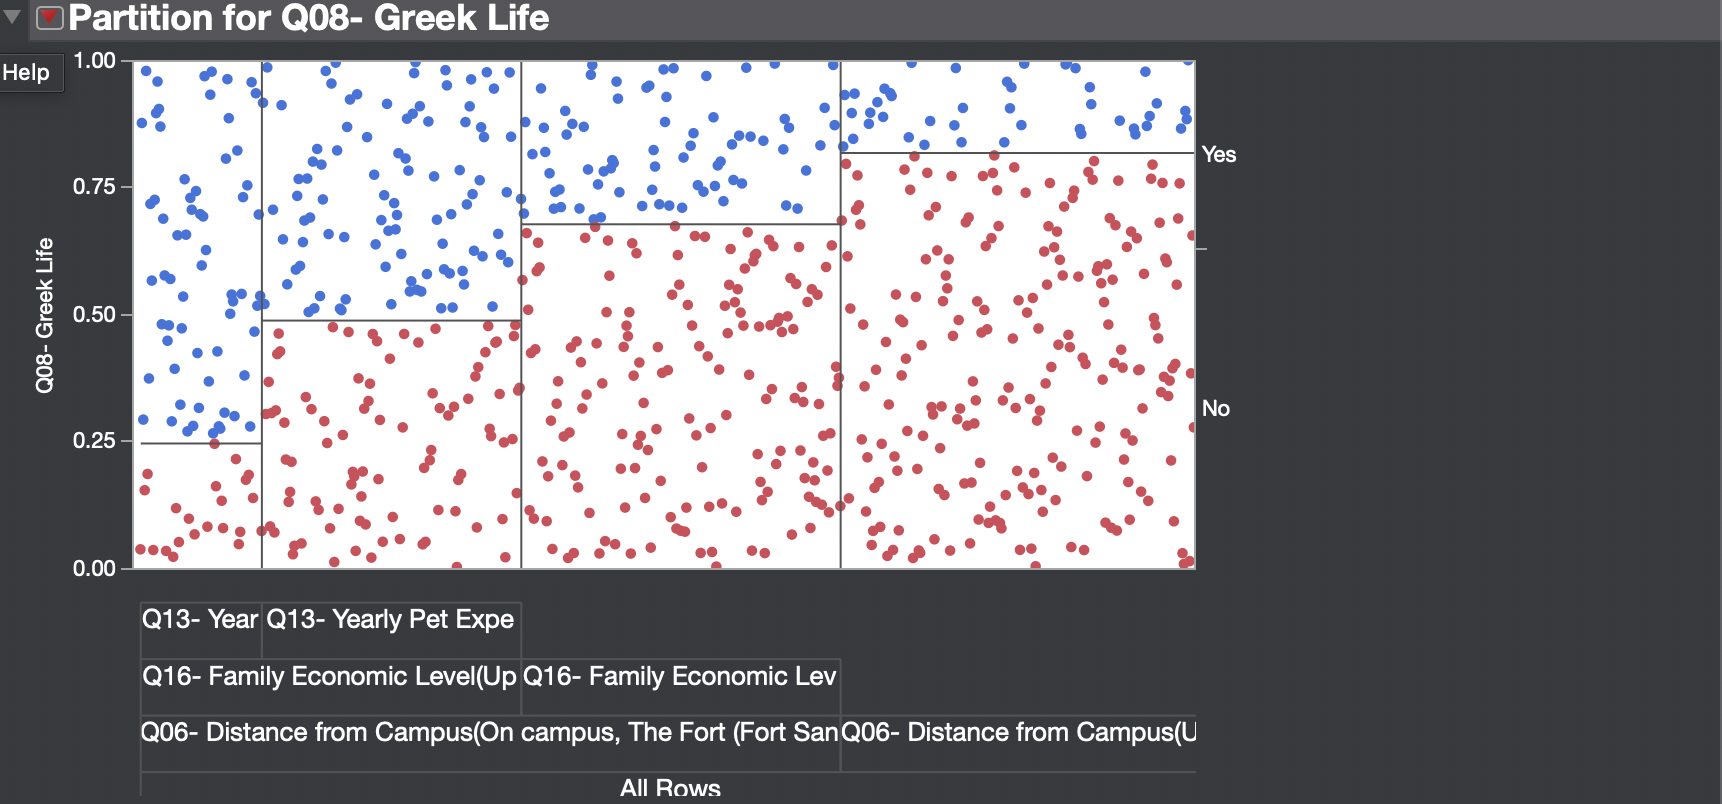
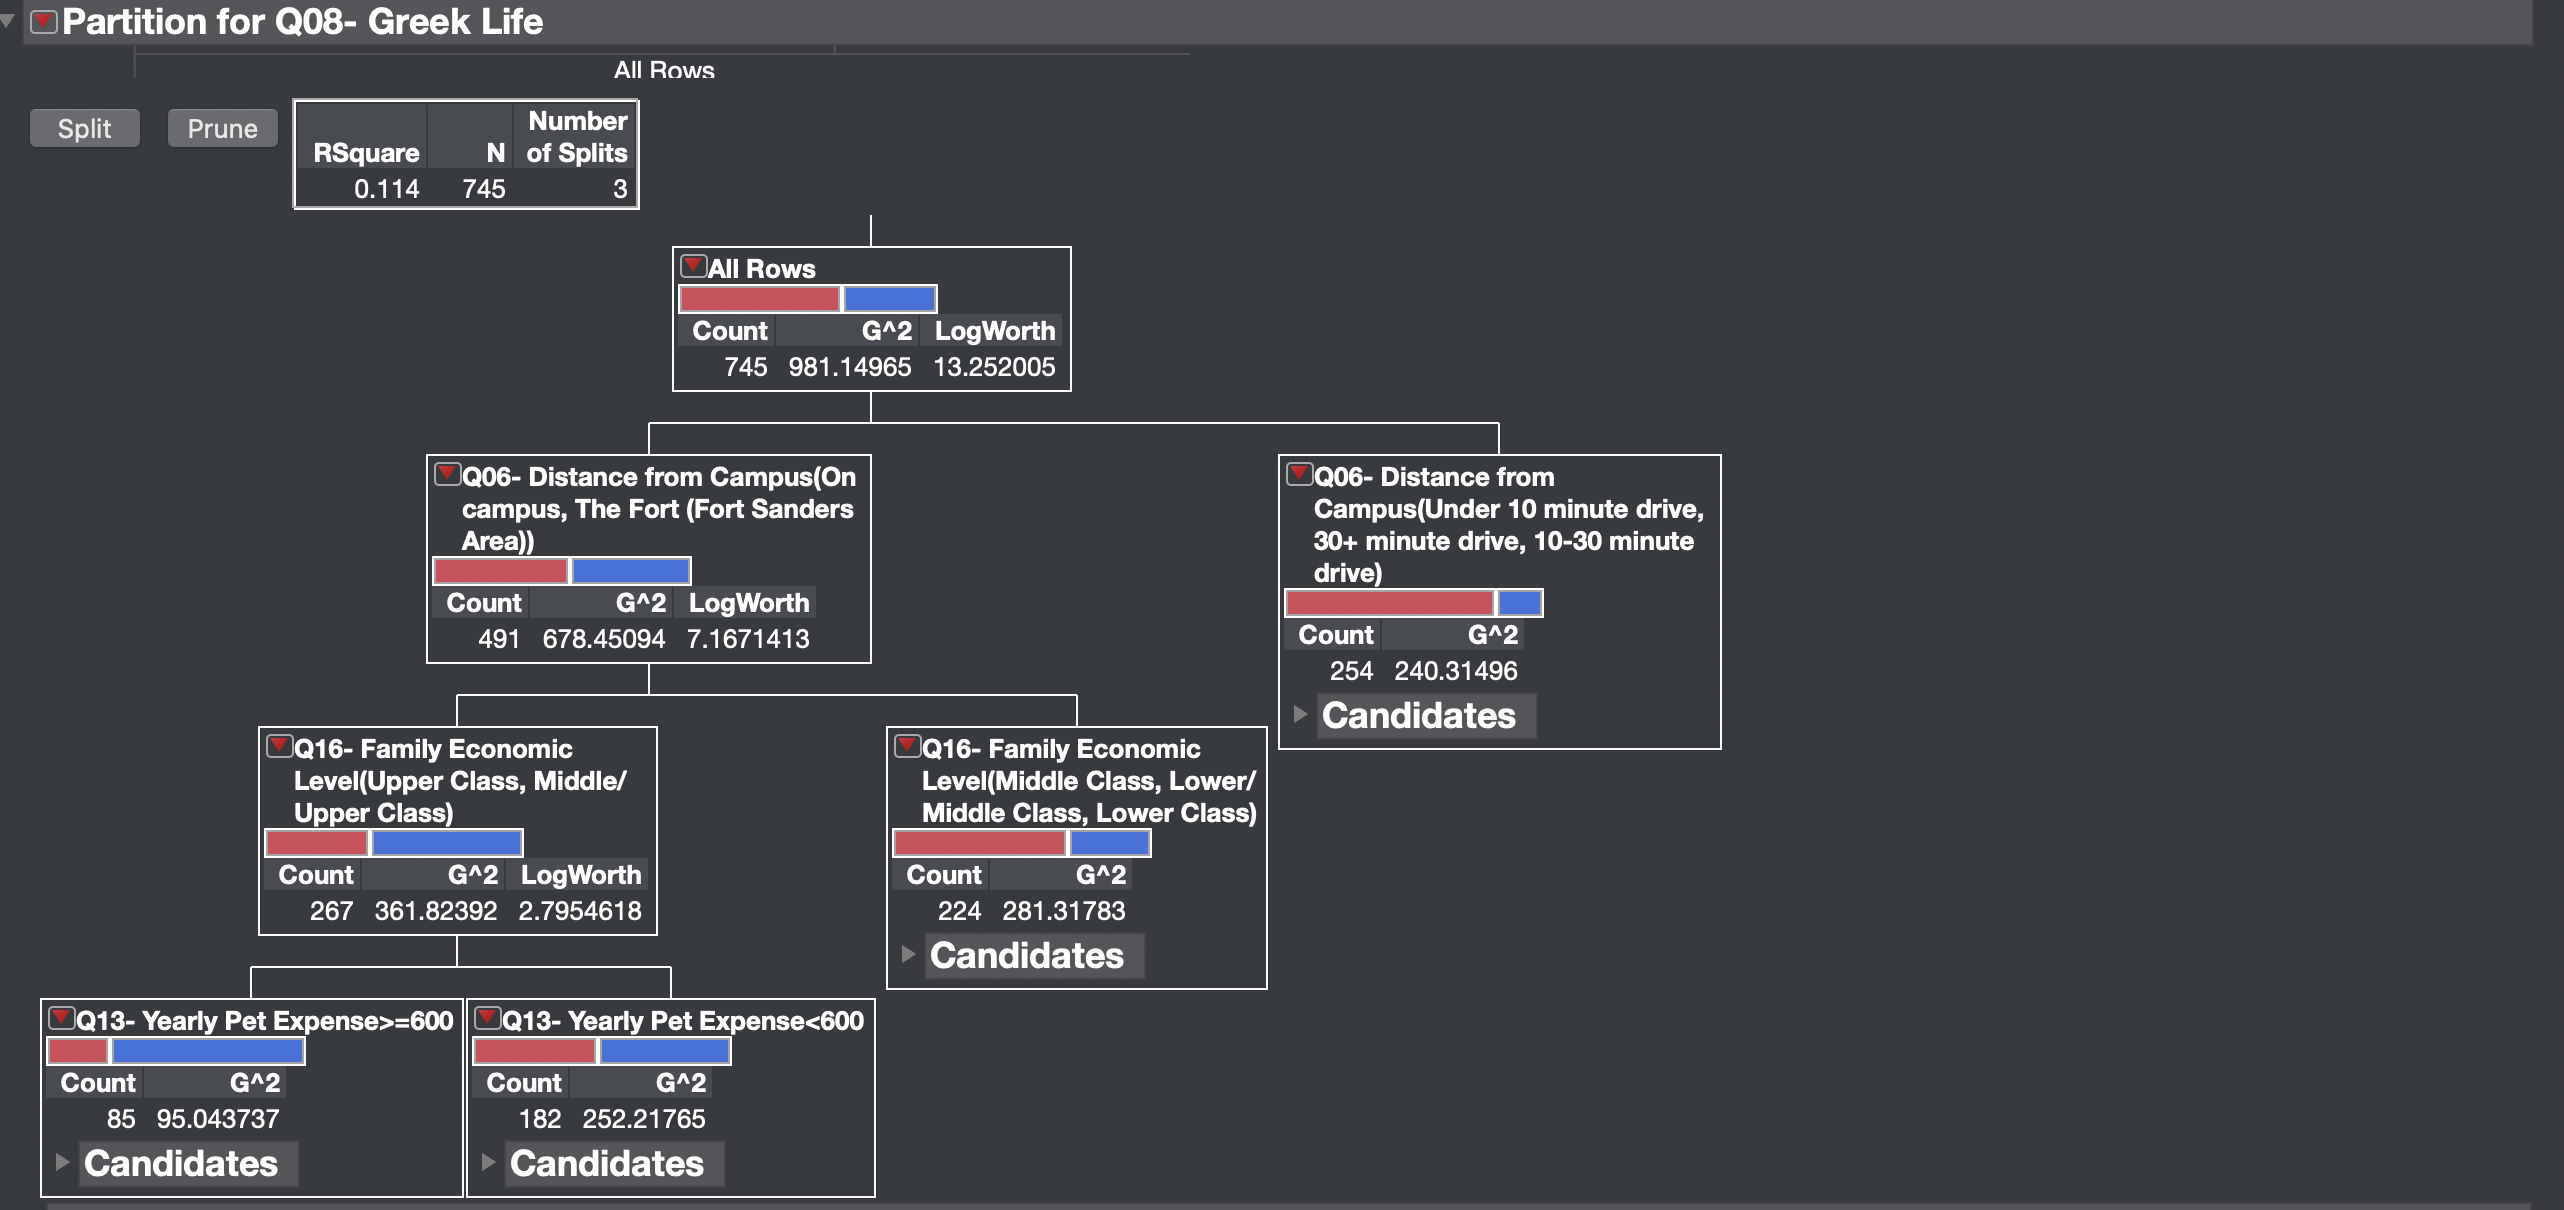
V Partition for Q08- Greek Life Help 1.00 Yes 0.75 Q08- Greek Life 0.50 No 0.25 0.00 Q13- Year Q13- Yearly Pet Expe Q16- Family Economic Level(Up Q16- Family Economic Lev Q06- Distance from Campus(On campus, The Fort (Fort San Q06- Distance from Campus(U All RowsPartition for Q08- Greek Life All Rows Split Prune Number RSquare N of Splits 0.114 745 3 All ROWS Count G^2 LogWorth 745 981.14965 13.252005 QQ06- Distance from Campus(On QQ06- Distance from campus, The Fort (Fort Sanders Campus(Under 10 minute drive, Area) 30+ minute drive, 10-30 minute drive) Count G^2 LogWorth 491 678.45094 7.1671413 Count G^2 254 240.31496 Candidates QQ16- Family Economic Q16- Family Economic Level(Upper Class, Middle/ Level(Middle Class, Lower/ Upper Class Middle Class, Lower Class) Count G^2 LogWorth Count G^2 267 361.82392 2.7954618 224 281.31783 Candidates Q13- Yearly Pet Expense>=600 QQ13- Yearly Pet Expense=600 006 Distance from Campus(0n campus, The Fort (Fort Sanders Area))&016- Family Economic Level(Upper Class, Middle/Upper Class)&Q13- Yearly Pet Expense:600 006- Distance from Campus(0n campus, The Fort (Fort Sanders Area))&Q167 Family Economic Leve|(Upper Class, Middle/Upper CIass)&Q13 Yearly Pet Expense
Step by Step Solution
There are 3 Steps involved in it

Get step-by-step solutions from verified subject matter experts