

Question: answer both Histogram - SPY Histogram-WFC 14 8 12 7 6 10 8 5 4 6 4 Jill . 3 2 II 2 1 0
 answer both
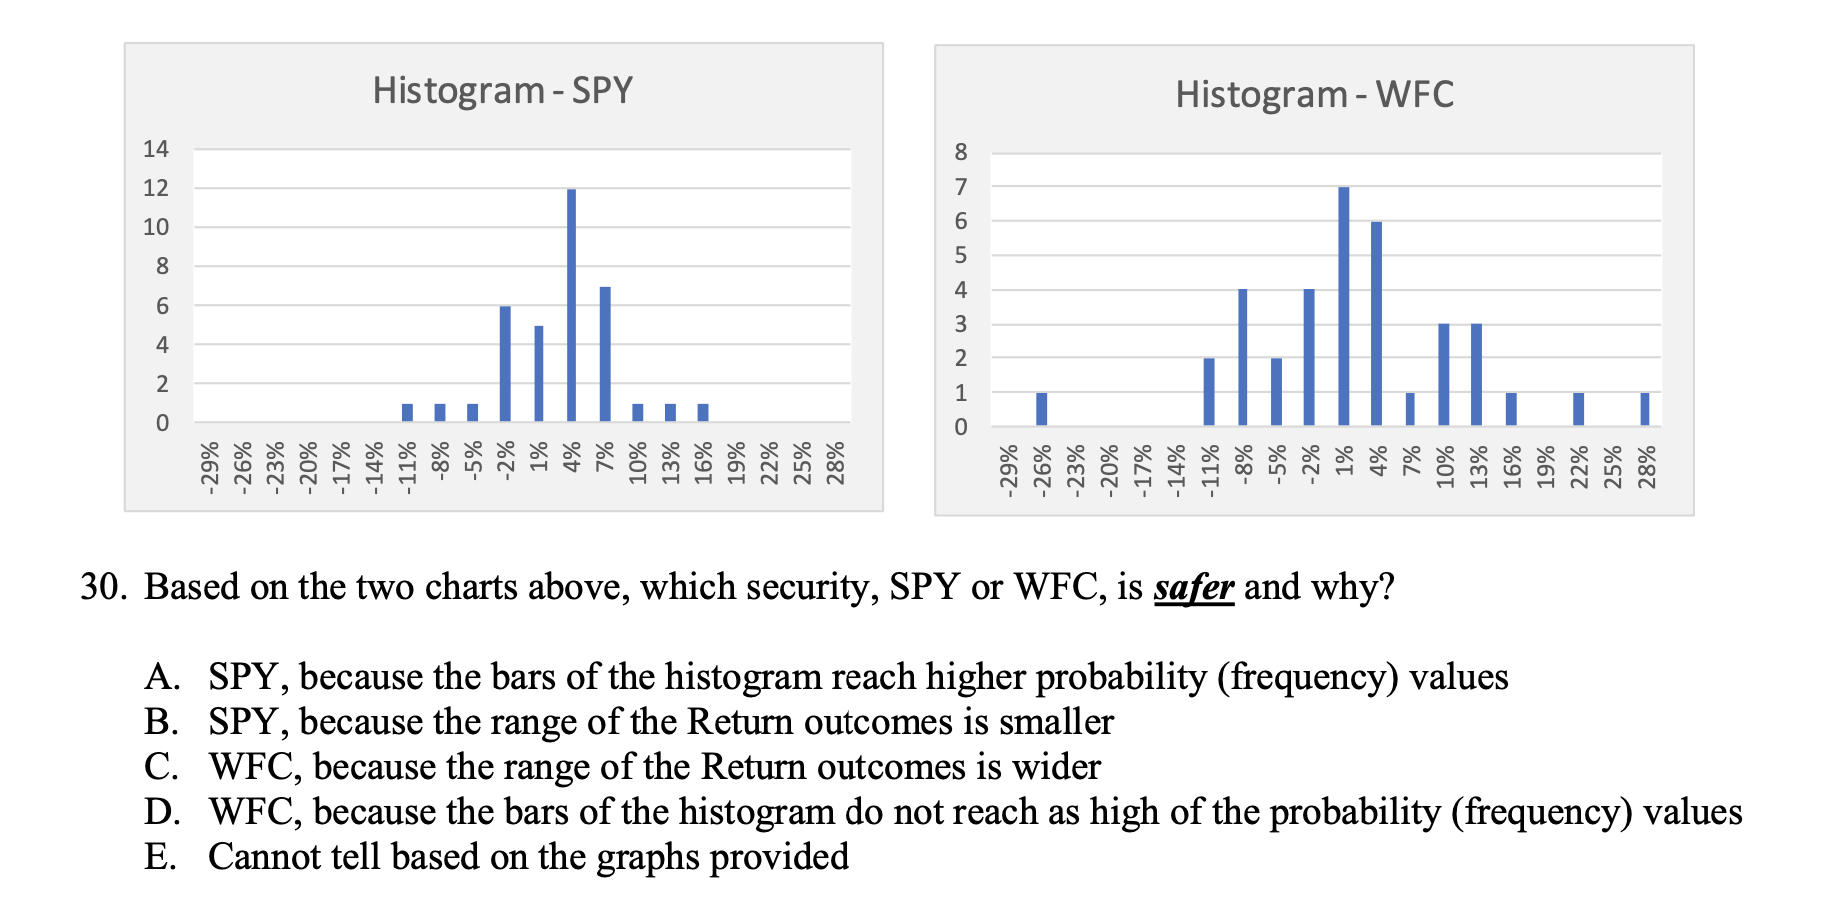
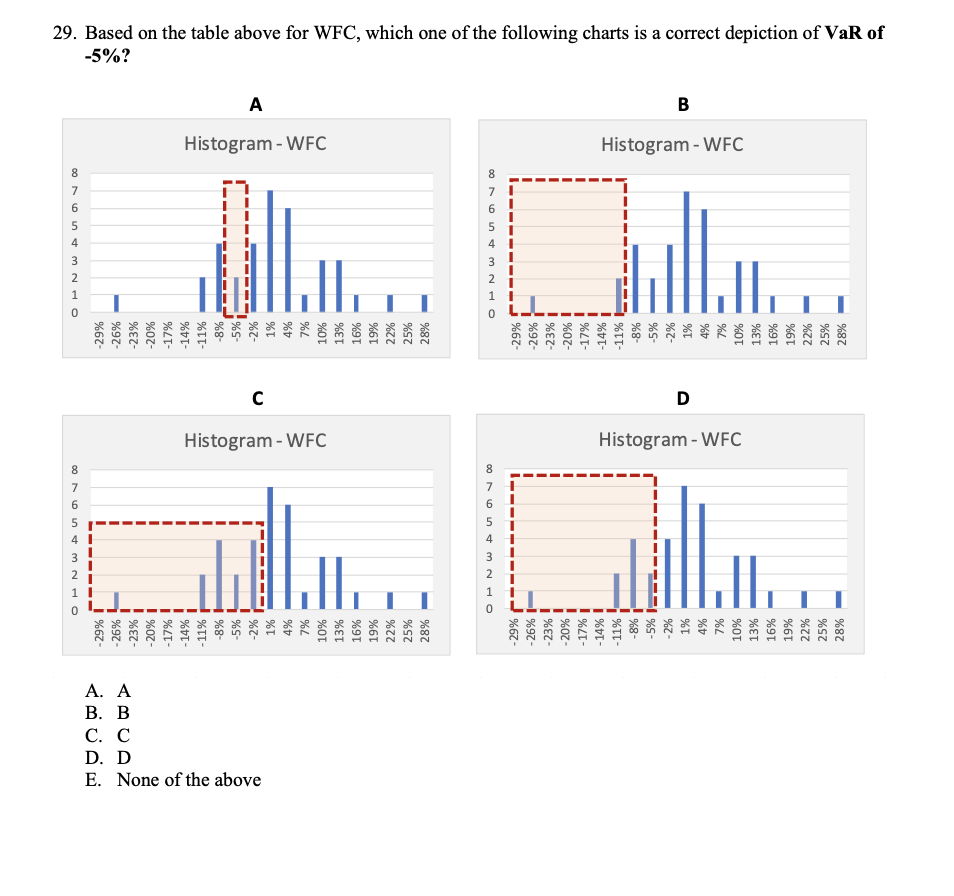
Histogram - SPY Histogram-WFC 14 8 12 7 6 10 8 5 4 6 4 Jill . 3 2 II 2 1 0 0 -8% - -5% - -29% -26% -23% 1% 4% 7% 10% - 13% 16% - 19% 22% 25% 28% 3 -29% -26% = -11% -8% -5% -2% 1% 4% 7% 10% 13% 16% 19% 22% 25% 28% 30. Based on the two charts above, which security, SPY or WFC, is safer and why? A. SPY, because the bars of the histogram reach higher probability (frequency) values B. SPY, because the range of the Return outcomes is smaller C. WFC, because the range of the Return outcomes is wider D. WFC, because the bars of the histogram do not reach as high of the probability (frequency) values E. Cannot tell based on the graphs provided 0 N u 6 7 8 1 2 3 4 5 9 2 3 5 41 00 29% -26% -29% -26% 1 D. D C. C B. B A. A E. None of the above -14% ! % Histogram - WFC - 11% -8% -5% -2% 1% 4% 7% 10% 13% 16% 19% 22% 25% 28% -8% -5% -2% 1% 4% 7% 10% 13% 16% 19% 22% 25% 28% Histogram - WFC -5%? 29. Based on the table above for WFC, which one of the following charts is a correct depiction of VaR of m No w 0 1 2 3 4 5 6 7 00 o 9 00 NMNO 7 8 2 1 1 4 1 -29% -26% -23% ! Histogram - WFC -29% -26% -23% i -20% 1 -17% ! -14% -11% -8% -5% -2% 1% 4% 7% 10% 20% -17% - 14% - 11% -8% -5% -2% 1% 4% 7% 10% 13% 16% 19% 22% 25% 28% Histogram - WFC D B %ET 16% 19% 22% 25% 28% Histogram - SPY Histogram-WFC 14 8 12 7 6 10 8 5 4 6 4 Jill . 3 2 II 2 1 0 0 -8% - -5% - -29% -26% -23% 1% 4% 7% 10% - 13% 16% - 19% 22% 25% 28% 3 -29% -26% = -11% -8% -5% -2% 1% 4% 7% 10% 13% 16% 19% 22% 25% 28% 30. Based on the two charts above, which security, SPY or WFC, is safer and why? A. SPY, because the bars of the histogram reach higher probability (frequency) values B. SPY, because the range of the Return outcomes is smaller C. WFC, because the range of the Return outcomes is wider D. WFC, because the bars of the histogram do not reach as high of the probability (frequency) values E. Cannot tell based on the graphs provided 0 N u 6 7 8 1 2 3 4 5 9 2 3 5 41 00 29% -26% -29% -26% 1 D. D C. C B. B A. A E. None of the above -14% ! % Histogram - WFC - 11% -8% -5% -2% 1% 4% 7% 10% 13% 16% 19% 22% 25% 28% -8% -5% -2% 1% 4% 7% 10% 13% 16% 19% 22% 25% 28% Histogram - WFC -5%? 29. Based on the table above for WFC, which one of the following charts is a correct depiction of VaR of m No w 0 1 2 3 4 5 6 7 00 o 9 00 NMNO 7 8 2 1 1 4 1 -29% -26% -23% ! Histogram - WFC -29% -26% -23% i -20% 1 -17% ! -14% -11% -8% -5% -2% 1% 4% 7% 10% 20% -17% - 14% - 11% -8% -5% -2% 1% 4% 7% 10% 13% 16% 19% 22% 25% 28% Histogram - WFC D B %ET 16% 19% 22% 25% 28%
Step by Step Solution
There are 3 Steps involved in it

Get step-by-step solutions from verified subject matter experts