

Question: Answer c, d, and e,..do not use a spread sheet, I cannot use a spread sheet in an exam, I need clear calculations which are
Answer c, d, and e,..do not use a spread sheet, I cannot use a spread sheet in an exam, I need clear calculations which are not excel generated, I need to see step-by- step equations and evaluations.
The question is as it is, n for what
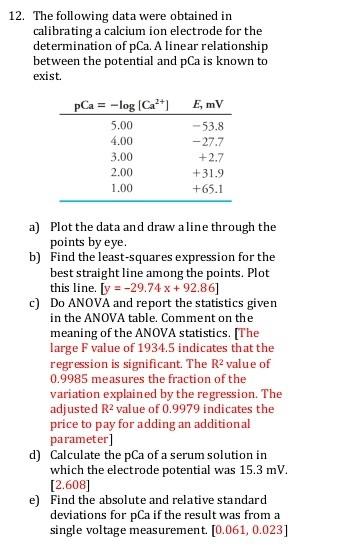
12. The following data were obtained in calibrating a calcium ion electrode for the determination of pCa. A linear relationship between the potential and pCa is known to exist. a) Plot the data and draw aline through the points by eye. b) Find the least-squares expression for the best straight line among the points. Plot this line. [y=29.74x+92.86] c) Do ANOVA and report the statistics given in the ANOVA table. Comment on the meaning of the ANOVA statistics. [The large F value of 1934.5 indicates that the regression is significant. The R2 value of 0.9985 measures the fraction of the variation explained by the regression. The adjusted R2 value of 0.9979 indicates the price to pay for adding an additional parameter] d) Calculate the pCa of a serum solution in which the electrode potential was 15.3mV. [2.608] e) Find the absolute and relative standard deviations for pCa if the result was from a single voltage measurement. [0.061,0.023]
Step by Step Solution
There are 3 Steps involved in it

Get step-by-step solutions from verified subject matter experts