

Question: answer C please DATAFile: AgeCost You may need to use the appropriate technology to answer this question. The regional transit authority for a major metropolitan
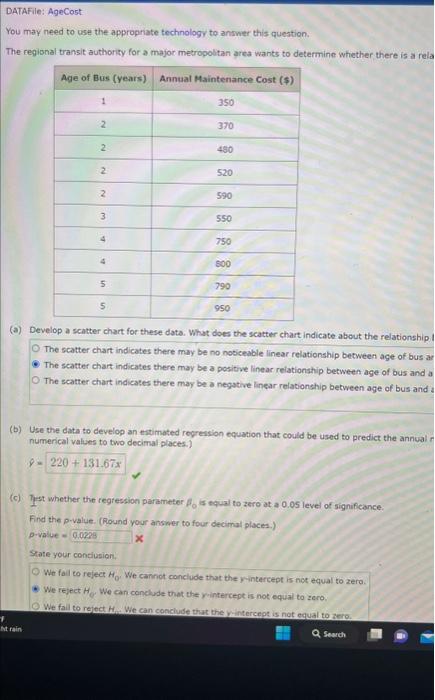
DATAFile: AgeCost You may need to use the appropriate technology to answer this question. The regional transit authority for a major metropolitan area wants to determine whiether there is a rela (a) Develop a scatter chart for these data. What does the scatter chart indicate about the relationship The scatter chart indicates there may be no noticeable linear relationship between age of bus ar The scatter chart indicates there may be a pesitive line ar reiationship between age of bus and a The scatter chart indicates there may be a negative linear relationship between age of bus and 4 (b) Use the data to develop an estimated rogression equation that could be used to predict the anncal f numerical values to two decimal places.) (c) Test whether the regression parameter 0 is equal to zero at a 0.05 level of significance. Find the p-value. (Round your answer to four decimal places.) p-value = State your conclusion. We fail to reject H0, We cannot conclude that the yintercept is not equal to zero. We reject H0, We can conclude that the ruintercept is not equal to zero
Step by Step Solution
There are 3 Steps involved in it

Get step-by-step solutions from verified subject matter experts