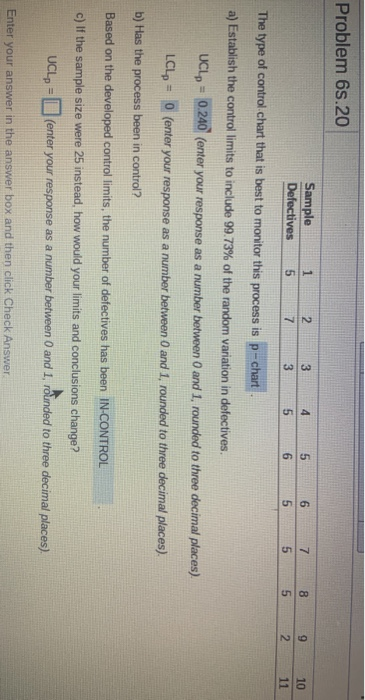
Question: Answer C Please Problem 65.20 Sample Defectives 5 3 4 5 6 7 8 9 10 3565552 11 The type of control chart that is

Answer C Please
Answer C Please Problem 65.20 Sample Defectives 5
Problem 65.20 Sample Defectives 5 3 4 5 6 7 8 9 10 3565552 11 The type of control chart that is best to monitor this process is p-chart a) Establish the control limits to include 99.73% of the random variation in defectives UCLA = 0.240 (enter your response as a number between 0 and 1. rounded to three decimal places) LCLP = 0 (enter your response as a number between 0 and 1. rounded to three decimal places). b) Has the process been in control? Based on the developed control limits, the number of defectives has been IN-CONTROL c) If the sample size were 25 instead, how would your limits and conclusions change? UCL (enter your response as a number between 0 and 1, rounded to three decimal places) Enter your answer in the answer box and then click Check

Step by Step Solution

There are 3 Steps involved in it

1 Expert Approved Answer
Step: 1 Unlock blur-text-image
Question Has Been Solved by an Expert!

Get step-by-step solutions from verified subject matter experts

Step: 2 Unlock
Step: 3 Unlock

Students Have Also Explored These Related General Management Questions!