

Question: Answer clearly Draw an aggregate supply curve. Label it. Price level (GDP price index, 2009=100) 150- 140- As an economy moves up along its aggregate
Answer clearly
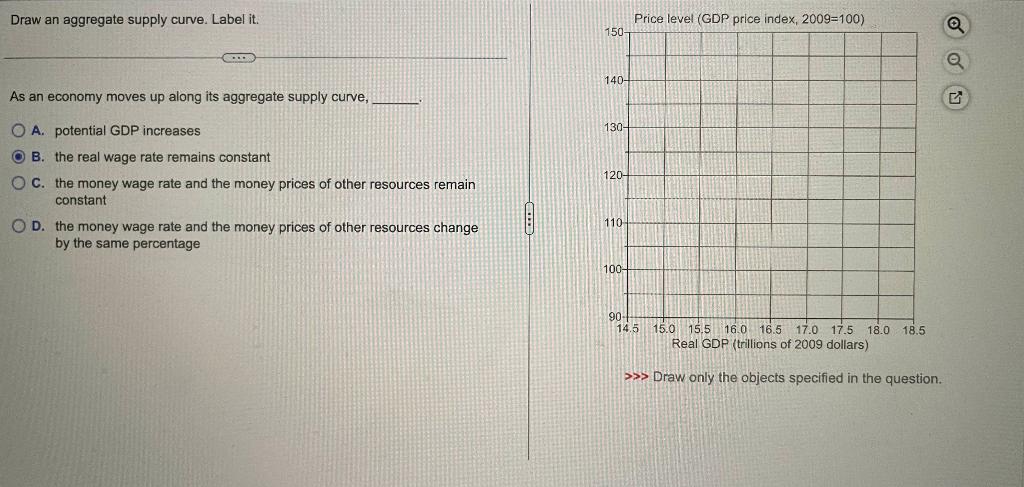
Draw an aggregate supply curve. Label it. Price level (GDP price index, 2009=100) 150- 140- As an economy moves up along its aggregate supply curve, O A. potential GDP increases 130- O B. the real wage rate remains constant 120- O C. the money wage rate and the money prices of other resources remain constant O D. the money wage rate and the money prices of other resources change 110 by the same percentage 100- 90- 14.5 15.0 15.5 160 16.5 17.0 17.5 18.0 18.5 Real GDP (trillions of 2009 dollars) > > Draw only the objects specified in the
Step by Step Solution
There are 3 Steps involved in it
1 Expert Approved Answer
Step: 1 Unlock

Question Has Been Solved by an Expert!
Get step-by-step solutions from verified subject matter experts
Step: 2 Unlock
Step: 3 Unlock