

Question: answer code please Forced expiratory volume (FEV) is a standard measure of pulmonary function and is known to be a function of age and height.
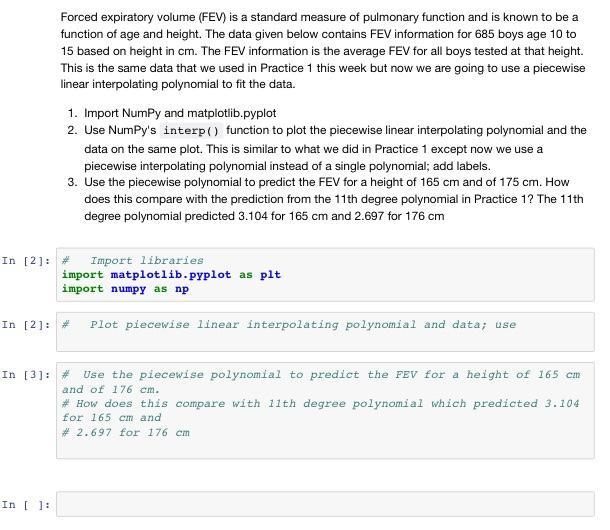
Forced expiratory volume (FEV) is a standard measure of pulmonary function and is known to be a function of age and height. The data given below contains FEV information for 685 boys age 10 to 15 based on height in cm. The FEV information is the average FEV for all boys tested at that height. This is the same data that we used in Practice 1 this week but now we are going to use a piecewise linear interpolating polynomial to fit the data. 1. Import NumPy and matplotlib.pyplot 2. Use NumPy's interp () function to plot the piecewise linear interpolating polynomial and the data on the same plot. This is similar to what we did in Practice 1 except now we use a piecewise interpolating polynomial instead of a single polynomial; add labels. 3. Use the piecewise polynomial to predict the FEV for a height of 165cm and of 175cm. How does this compare with the prediction from the 11th degree polynomial in Practice 1? The 11th degree polynomial predicted 3.104 for 165cm and 2.697 for 176cm \# Import libraries import matplotlib.pyplot as plt import numpy as np \# Plot piecewise linear interpolating polynomial and data; use \# Use the piecewise polynomial to predict the FEV for a height of 165cm and of 176cm. \# How does this compare with 11 th degree polynomial which predicted 3.104 for 165cm and * 2.697 for 176cm Forced expiratory volume (FEV) is a standard measure of pulmonary function and is known to be a function of age and height. The data given below contains FEV information for 685 boys age 10 to 15 based on height in cm. The FEV information is the average FEV for all boys tested at that height. This is the same data that we used in Practice 1 this week but now we are going to use a piecewise linear interpolating polynomial to fit the data. 1. Import NumPy and matplotlib.pyplot 2. Use NumPy's interp () function to plot the piecewise linear interpolating polynomial and the data on the same plot. This is similar to what we did in Practice 1 except now we use a piecewise interpolating polynomial instead of a single polynomial; add labels. 3. Use the piecewise polynomial to predict the FEV for a height of 165cm and of 175cm. How does this compare with the prediction from the 11th degree polynomial in Practice 1? The 11th degree polynomial predicted 3.104 for 165cm and 2.697 for 176cm \# Import libraries import matplotlib.pyplot as plt import numpy as np \# Plot piecewise linear interpolating polynomial and data; use \# Use the piecewise polynomial to predict the FEV for a height of 165cm and of 176cm. \# How does this compare with 11 th degree polynomial which predicted 3.104 for 165cm and * 2.697 for 176cm
Step by Step Solution
There are 3 Steps involved in it

Get step-by-step solutions from verified subject matter experts