

Question: Answer each part showing work step my step Background: The butterfat content of random samples of Guernsey, Holstein and Jersey cows are provided below. Each
Answer each part showing work step my step
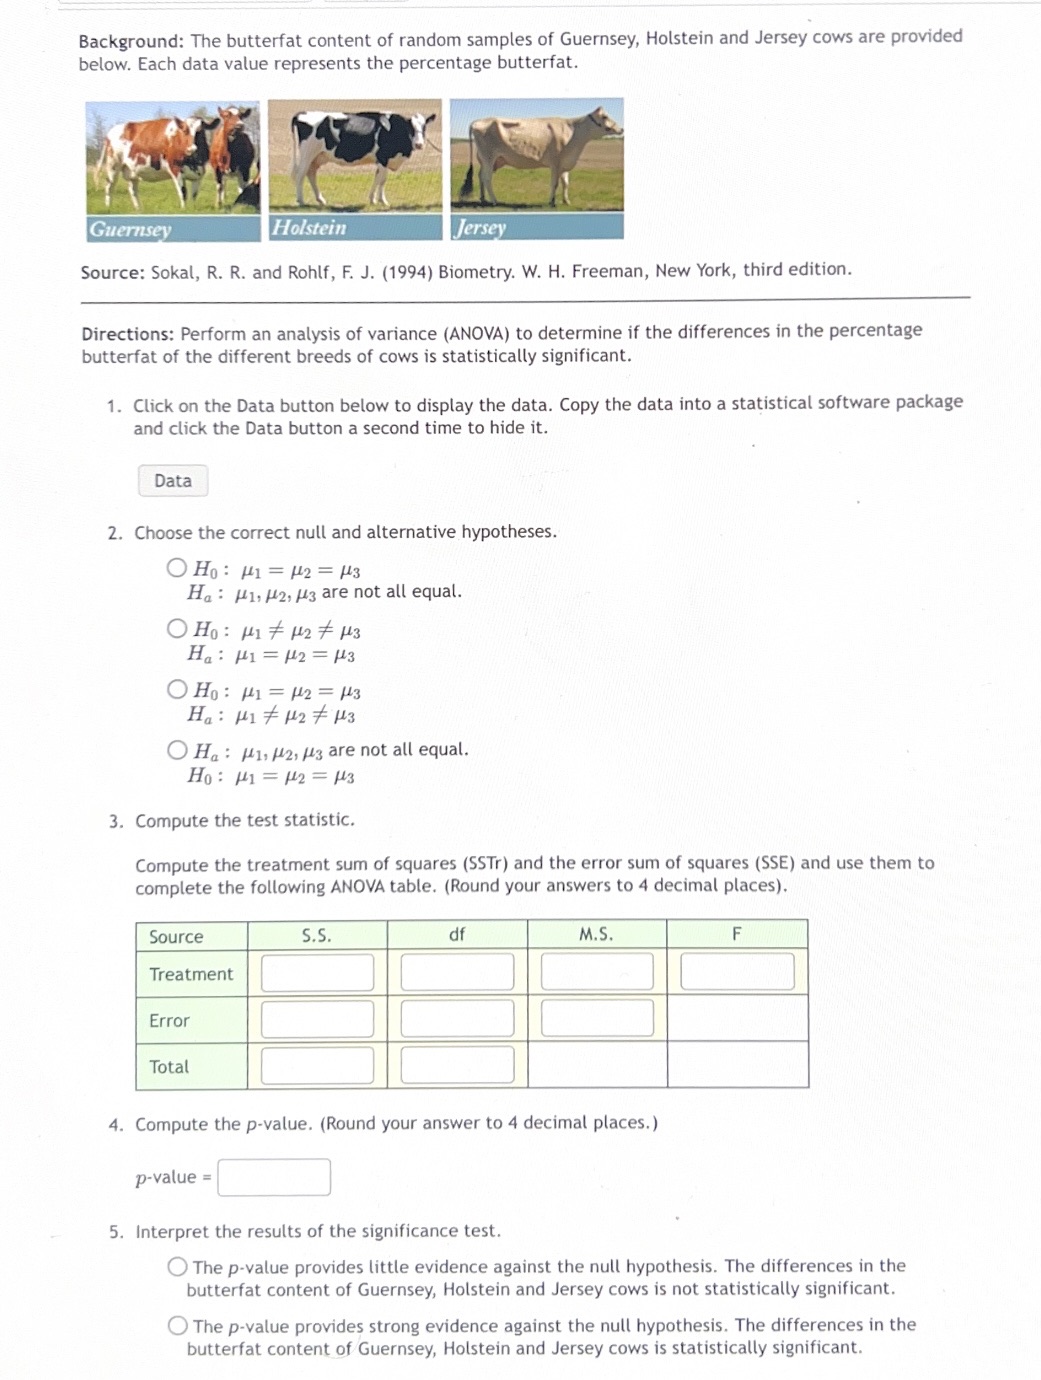
Background: The butterfat content of random samples of Guernsey, Holstein and Jersey cows are provided below. Each data value represents the percentage butterfat. Guernsey Holstein Jersey Source: Sokal, R. R. and Rohlf, F. J. (1994) Biometry. W. H. Freeman, New York, third edition. Directions: Perform an analysis of variance (ANOVA) to determine if the differences in the percentage butterfat of the different breeds of cows is statistically significant. 1. Click on the Data button below to display the data. Copy the data into a statistical software package and click the Data button a second time to hide it. Data 2. Choose the correct null and alternative hypotheses. O Ho : #1 = H2 = /3 Ha : H1, #2, /3 are not all equal. OHo: M1# 12# H3 Ha : H1 = /2 = /3 O Ho : #1 = H2 = /3 Ha : #1 # #2 # H3 O Ha : H1, /2, /3 are not all equal. Ho : #1 = /2 = /3 3. Compute the test statistic. Compute the treatment sum of squares (SSTr) and the error sum of squares (SSE) and use them to complete the following ANOVA table. (Round your answers to 4 decimal places). Source S. S. df M.S F Treatment Error Total 4. Compute the p-value. (Round your answer to 4 decimal places.) p-value = 5. Interpret the results of the significance test. The p-value provides little evidence against the null hypothesis. The differences in the butterfat content of Guernsey, Holstein and Jersey cows is not statistically significant. The p-value provides strong evidence against the null hypothesis. The differences in the butterfat content of Guernsey, Holstein and Jersey cows is statistically significant
Step by Step Solution
There are 3 Steps involved in it

Get step-by-step solutions from verified subject matter experts