

Question: answer exercise 2 please 12:36 . LTE 5.1 Continuous Prob... O In the figure below, we have four histograms representing the heights of 3,000,00 US
answer exercise 2 please
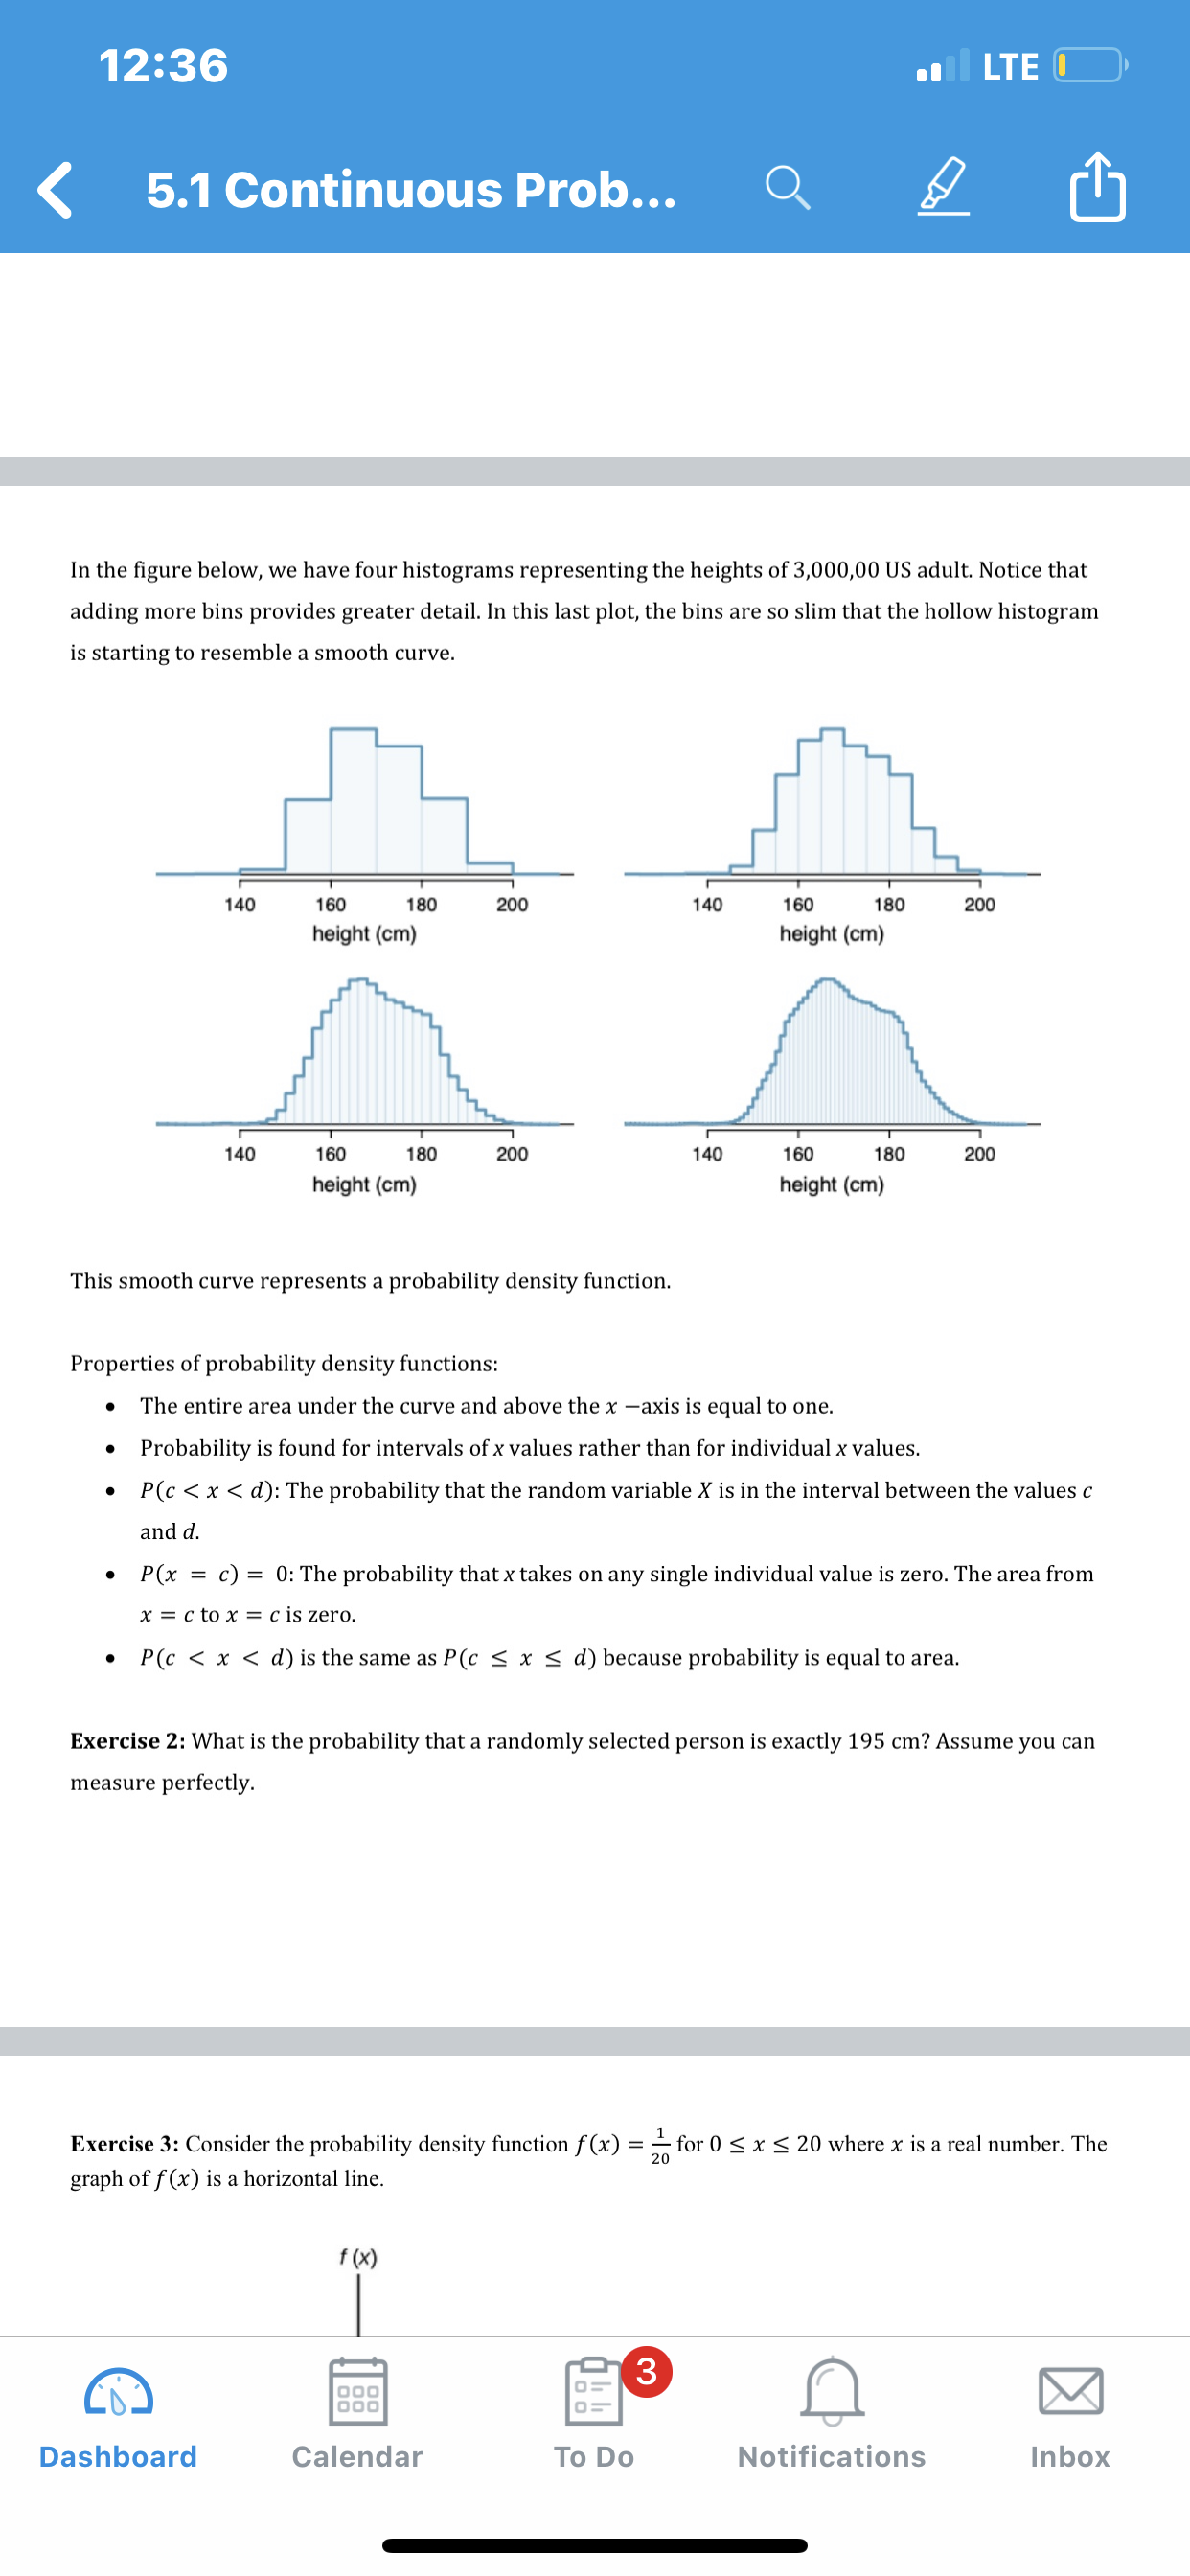
12:36 . LTE 5.1 Continuous Prob... O In the figure below, we have four histograms representing the heights of 3,000,00 US adult. Notice that adding more bins provides greater detail. In this last plot, the bins are so slim that the hollow histogram is starting to resemble a smooth curve. 140 160 180 200 140 160 180 200 height (cm) height (cm) 140 160 180 200 140 160 180 200 height (cm) height (cm) This smooth curve represents a probability density function. Properties of probability density functions: . The entire area under the curve and above the x -axis is equal to one. Probability is found for intervals of x values rather than for individual x values. P(c
Step by Step Solution
There are 3 Steps involved in it

Get step-by-step solutions from verified subject matter experts