

Question: - Answer for question 1 is in the attached excel screenshot. based on that please answer questions 2 and 3 Utilizing the DQ Week 3
- Answer for question 1 is in the attached excel screenshot. based on that please answer questions 2 and 3
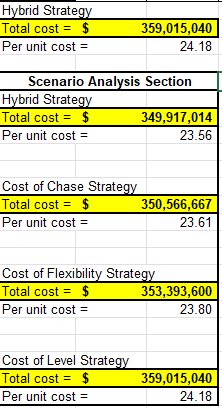
- Utilizing the DQ Week 3 Template in Week 3 materials, complete scenarios for each of the Aggregate Planning Strategies. Go to the data tab, copy the data in each column for Chase, Flex, and Level into the Cost column (right now the original column data is in the Cost column). Then click on Production tab and run Solver. You will need to this for each strategy. .
- Once completed compare and contrast the results for each strategy in terms of soft costs (impact to people and brand image) and tangible costs (financials).
- Identify one company or industry which utilizes each of the strategies (exclusively) and identify how you see them implementing it.
Step by Step Solution
There are 3 Steps involved in it
1 Expert Approved Answer
Step: 1 Unlock

Question Has Been Solved by an Expert!
Get step-by-step solutions from verified subject matter experts
Step: 2 Unlock
Step: 3 Unlock