

Question: Answer from A to D please Instructions: The table below shows income (in thousands of dollars) from sales of a particular product over a four
Answer from A to D please
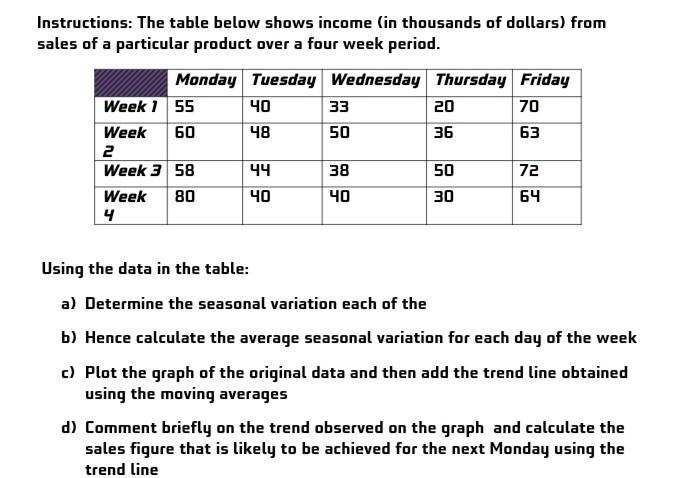
Instructions: The table below shows income (in thousands of dollars) from sales of a particular product over a four week period. Monday Tuesday Wednesday Thursday Friday Week 1 55 40 33 20 70 Week 60 48 50 36 63 2 Week 3 58 44 38 50 72 Week 80 40 40 30 64 4 Using the data in the table: a) Determine the seasonal variation each of the b) Hence calculate the average seasonal variation for each day of the week c) Plot the graph of the original data and then add the trend line obtained using the moving averages d) Comment briefly on the trend observed on the graph and calculate the sales figure that is likely to be achieved for the next Monday using the trend lineStep by Step Solution
There are 3 Steps involved in it
1 Expert Approved Answer
Step: 1 Unlock

Question Has Been Solved by an Expert!
Get step-by-step solutions from verified subject matter experts
Step: 2 Unlock
Step: 3 Unlock