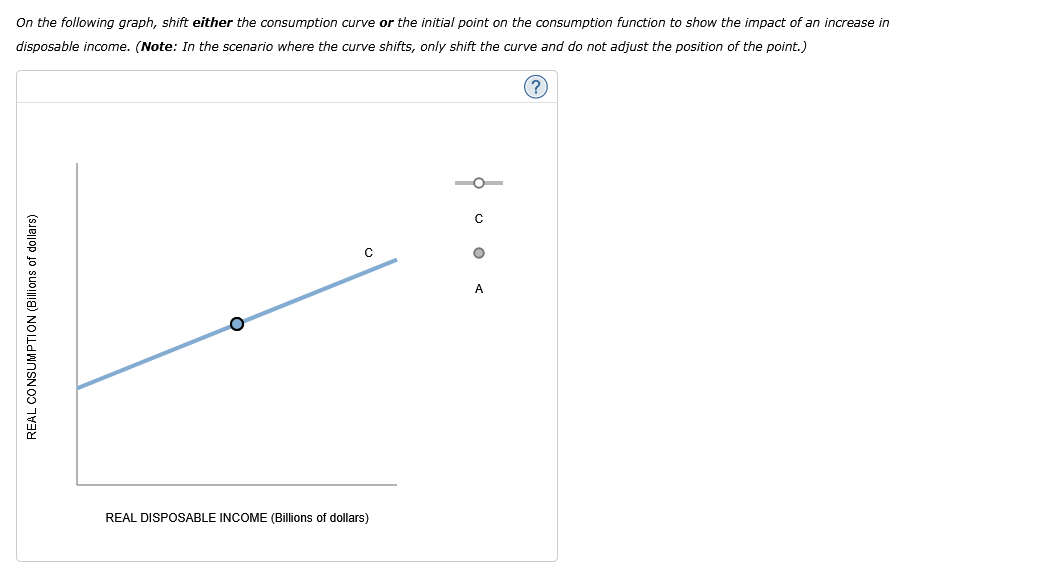
Question: answer graph On the following graph, shift either the consumption curve or the initia! point on the consumption function to show the impact of an

answer graph

answer graph On the following graph, shift either
On the following graph, shift either the consumption curve or the initia! point on the consumption function to show the impact of an increase in disposable income. (Note: In the scenario where the curve shifts, only shift the curve and do not adjust the position of the point.) @ REAL CONSUMPTION (Billions of dollars) REAL DISPOSABLE INCOME (Billions of dollars)

Step by Step Solution

There are 3 Steps involved in it

1 Expert Approved Answer
Step: 1 Unlock blur-text-image
Question Has Been Solved by an Expert!

Get step-by-step solutions from verified subject matter experts

Step: 2 Unlock
Step: 3 Unlock

Students Have Also Explored These Related Mathematics Questions!