

Question: answer in detail The following data represent the wait time (in minutes) for a random sample of 40 visitors to Disney's Dinosaur Ride in Animal
answer in detail
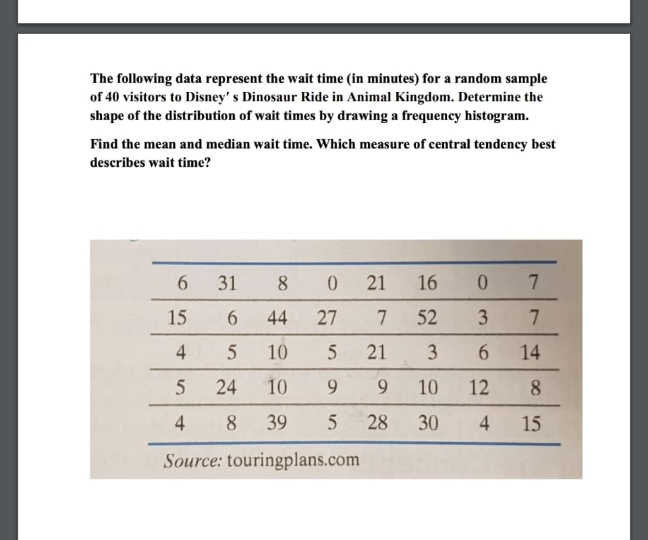
The following data represent the wait time (in minutes) for a random sample of 40 visitors to Disney's Dinosaur Ride in Animal Kingdom. Determine the shape of the distribution of wait times by drawing a frequency histogram. Find the mean and median wait time. Which measure of central tendency best describes wait time? 6 31 8 21 16 0 15 6 44 27 7 52 3 7 4 5 10 5 21 3 6 14 5 24 10 9 9 10 12 8 4 8 39 5 28 30 4 15 Source: touringplans.com
Step by Step Solution
There are 3 Steps involved in it
1 Expert Approved Answer
Step: 1 Unlock

Question Has Been Solved by an Expert!
Get step-by-step solutions from verified subject matter experts
Step: 2 Unlock
Step: 3 Unlock