

Question: answer in details amd show working. QUESTION 3 In a study of store scanning system efficiency, a sample of purchase was used to identify the
answer in details amd show working.
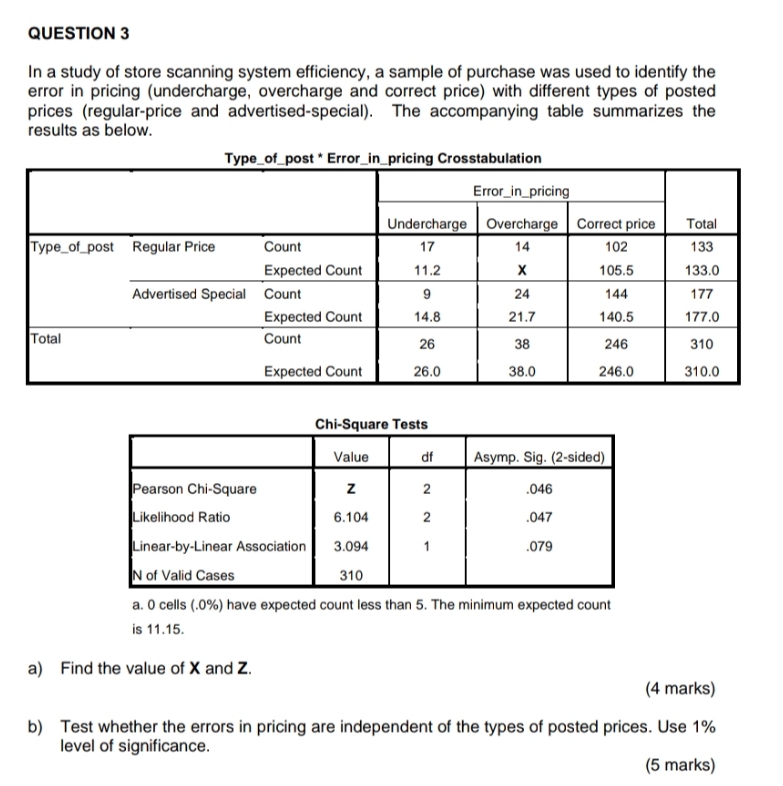
QUESTION 3 In a study of store scanning system efficiency, a sample of purchase was used to identify the error in pricing (undercharge, overcharge and correct price) with different types of posted prices (regular-price and advertised-special). The accompanying table summarizes the results as below. Type_of_post * Error_in_pricing Crosstabulation Error_in_pricing Undercharge Overcharge Correct price Total Type_of_post Regular Price Count 17 14 102 133 Expected Count 11.2 X 105.5 133.0 Advertised Special Count 9 24 144 177 Expected Count 14.8 21.7 140.5 177.0 Total Count 26 38 246 310 Expected Count 26.0 38.0 246.0 310.0 Chi-Square Tests Value df Asymp. Sig. (2-sided) Pearson Chi-Square Z 2 046 Likelihood Ratio 6.104 2 .047 Linear-by-Linear Association 3.094 079 N of Valid Cases 310 a. 0 cells (.0%) have expected count less than 5. The minimum expected count is 11.15. a) Find the value of X and Z. (4 marks) b) Test whether the errors in pricing are independent of the types of posted prices. Use 1% level of significance
Step by Step Solution
There are 3 Steps involved in it

Get step-by-step solutions from verified subject matter experts