

Question: answer in excel please. Problem 1 Plot out the spiderplot for the following Alternative. ALTERNATIVE 2-Renovate Nursing Towers [200,000 Gross Square Feet (GSF)] Renovation Construction
![the following Alternative. ALTERNATIVE 2-Renovate Nursing Towers [200,000 Gross Square Feet (GSF)]](https://s3.amazonaws.com/si.experts.images/answers/2024/08/66b871a55ee7f_74866b871a4cbc3f.jpg)
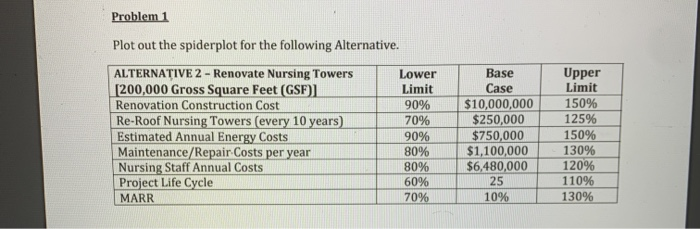
Problem 1 Plot out the spiderplot for the following Alternative. ALTERNATIVE 2-Renovate Nursing Towers [200,000 Gross Square Feet (GSF)] Renovation Construction Cost Re-Roof Nursing Towers (every 10 years) Estimated Annual Energy Costs Maintenance/Repair Costs per year Nursing Staff Annual Costs Project Life Cycle MARR Base Case $10,000,000 $250,000 Upper Limit Lower Limit 150% 90% 70% 125% $750,000 $1,100,000 $6,480,000 150% 130% 120% 90% 80% 80% 25 110% 60% 70% 10% 130% Problem 2 Plot out the tornado diagram for the following Alternative. ALTERNATIVE 3-Build Nursing Towers [180,000 Gross Square Feet (GSF)] New Construction Cost Salvage Value Estimated Annual Energy Costs Maintenance/Repair.Costs per year Nursing Staff Annual Costs Project Life Cycle Upper Lower Limit Base Case Limit 140% 110% 150% 130% 120% $21,600,000 $10,800,00 $650,000 $800,000 $5,180,000 90% 50% 90% 0% 80% 110% 70% 70% 25 130% 10% MARR Problem 1 Plot out the spiderplot for the following Alternative. ALTERNATIVE 2-Renovate Nursing Towers [200,000 Gross Square Feet (GSF)] Renovation Construction Cost Re-Roof Nursing Towers (every 10 years) Estimated Annual Energy Costs Maintenance/Repair Costs per year Nursing Staff Annual Costs Project Life Cycle MARR Base Case $10,000,000 $250,000 Upper Limit Lower Limit 150% 90% 70% 125% $750,000 $1,100,000 $6,480,000 150% 130% 120% 90% 80% 80% 25 110% 60% 70% 10% 130% Problem 2 Plot out the tornado diagram for the following Alternative. ALTERNATIVE 3-Build Nursing Towers [180,000 Gross Square Feet (GSF)] New Construction Cost Salvage Value Estimated Annual Energy Costs Maintenance/Repair.Costs per year Nursing Staff Annual Costs Project Life Cycle Upper Lower Limit Base Case Limit 140% 110% 150% 130% 120% $21,600,000 $10,800,00 $650,000 $800,000 $5,180,000 90% 50% 90% 0% 80% 110% 70% 70% 25 130% 10% MARR
Step by Step Solution
There are 3 Steps involved in it

Get step-by-step solutions from verified subject matter experts