

Question: Answer in Labview.show block diagram please. ill give thumps up. due in 20 minues sin (n x) Create a vi that graphs N points of
 Answer in Labview.show block diagram please. ill give thumps up. due in 20 minues
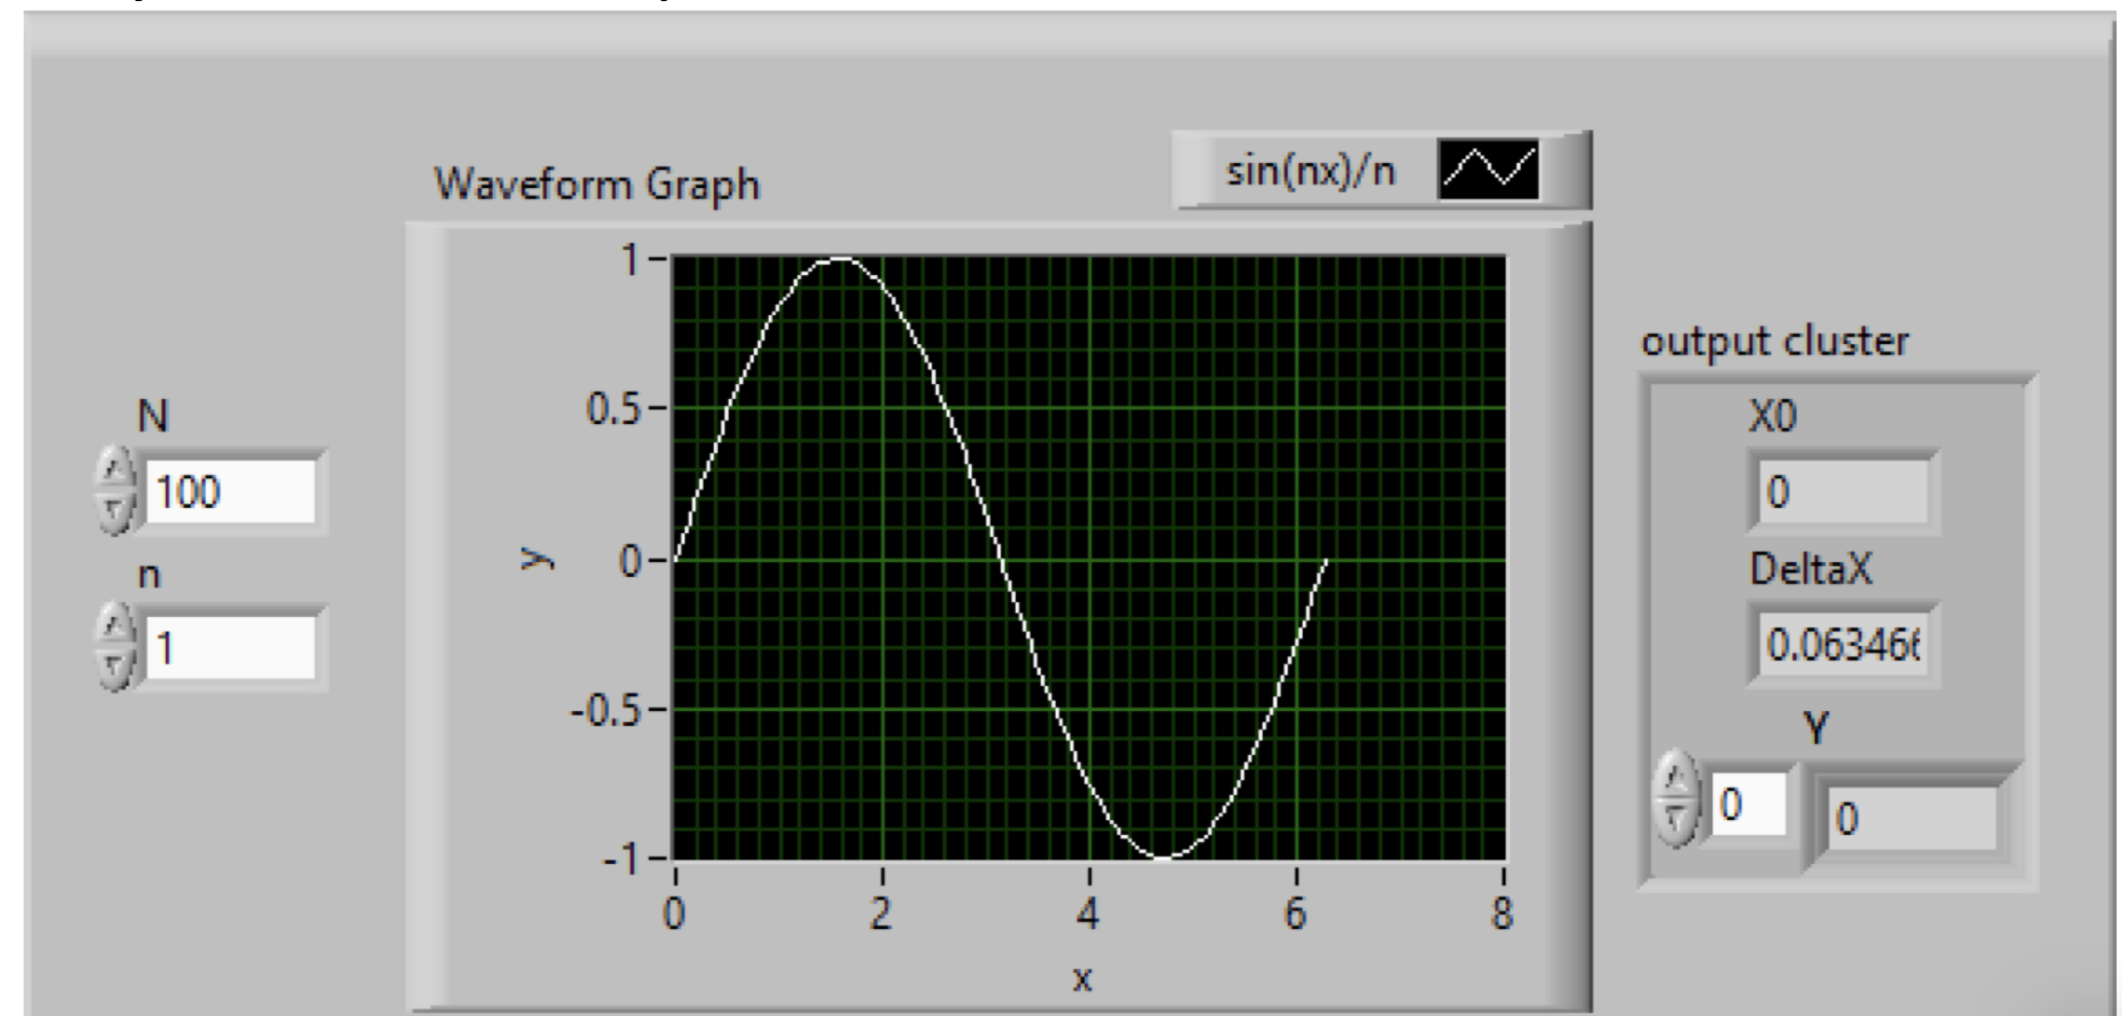
sin (n x) Create a vi that graphs N points of Y = where x goes from 0 to 21t. n and N n should be controls on the front panel. After you get the graph working, create a cluster indicator that has the starting x (x0), delta x (x spacing), and the Y array (this is the same cluster that you need to use to make the graph, but it should have labels (names) for the indicators within the cluster). Make the vi a subvi by connecting the N and n controls and the output cluster indicator to the connector pane, making an icon, and saving the vi. You only need to turn in the block diagram and front panel of this vi for this problem since you will use the subvi later. HINT: you might want to use your homework as a starting point for this problem since it is very similar to a homework problem. sin(nx) Waveform Graph 1- output cluster N 0.5- 100 0 n Deltax 0.06346 1 -0.5- Y 0 0 -1- 1 - -N 4 - 10 6 8 sin (n x) Create a vi that graphs N points of Y = where x goes from 0 to 21t. n and N n should be controls on the front panel. After you get the graph working, create a cluster indicator that has the starting x (x0), delta x (x spacing), and the Y array (this is the same cluster that you need to use to make the graph, but it should have labels (names) for the indicators within the cluster). Make the vi a subvi by connecting the N and n controls and the output cluster indicator to the connector pane, making an icon, and saving the vi. You only need to turn in the block diagram and front panel of this vi for this problem since you will use the subvi later. HINT: you might want to use your homework as a starting point for this problem since it is very similar to a homework problem. sin(nx) Waveform Graph 1- output cluster N 0.5- 100 0 n Deltax 0.06346 1 -0.5- Y 0 0 -1- 1 - -N 4 - 10 6 8
Step by Step Solution
There are 3 Steps involved in it

Get step-by-step solutions from verified subject matter experts