

Question: Answer just needed for part below The following financial information is for Oriole Company. Oriole Company Balance Sheets December 31 Assets 2022 2021 Cash $78,400
Answer just needed for part below
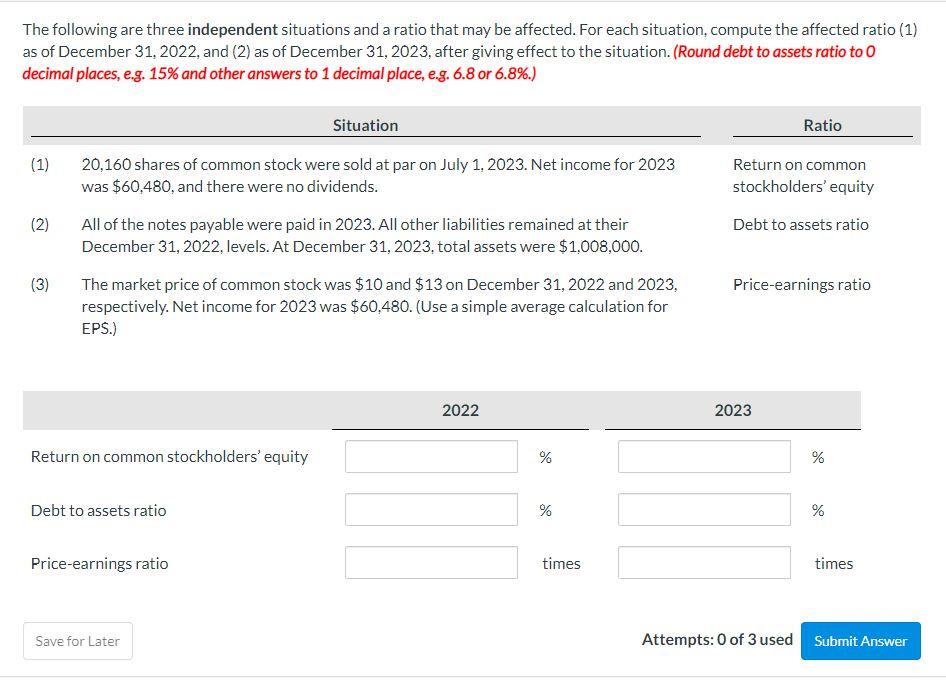
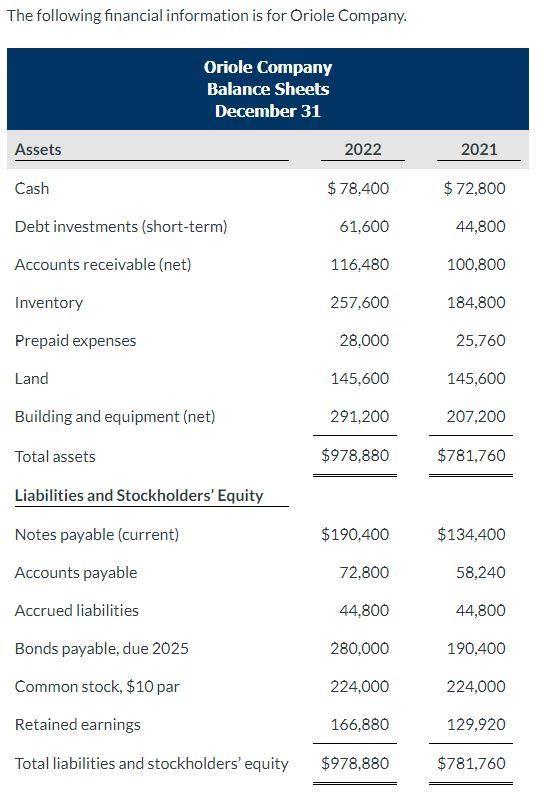
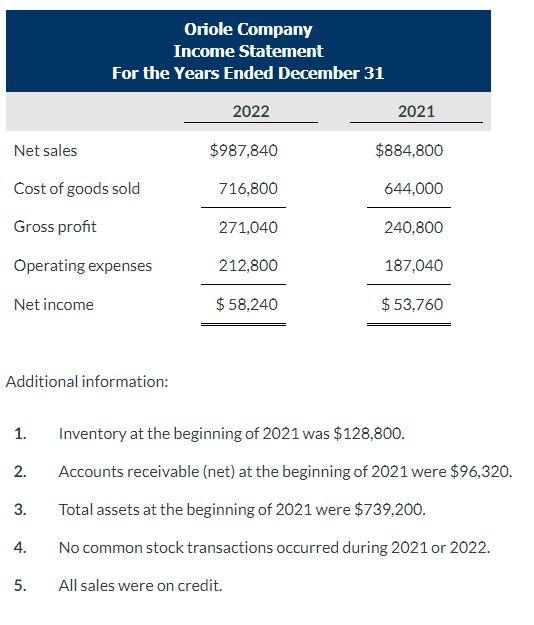
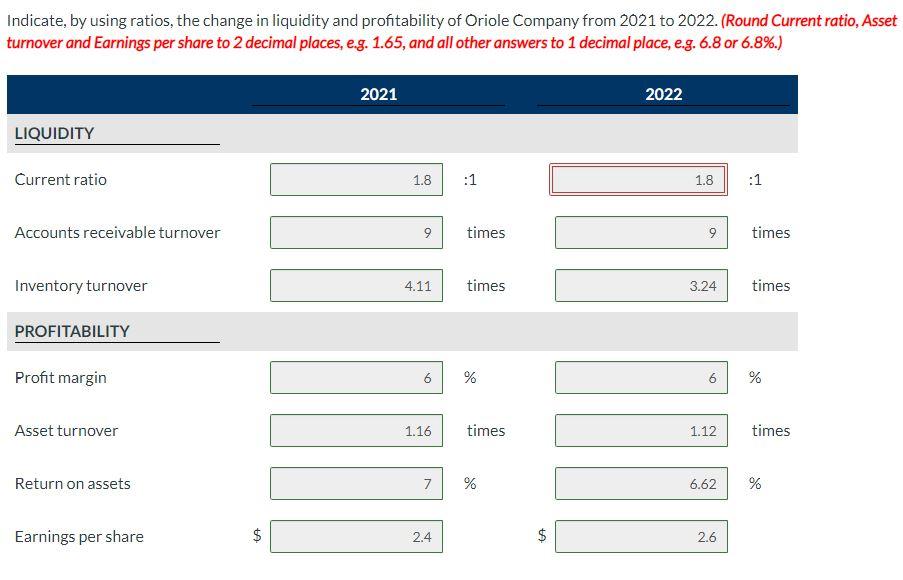
The following financial information is for Oriole Company. Oriole Company Balance Sheets December 31 Assets 2022 2021 Cash $78,400 $72,800 Debt investments (short-term) 61,600 44,800 Accounts receivable (net) 116,480 100,800 Inventory 257,600 184,800 Prepaid expenses 28,000 25,760 Land 145,600 145,600 Building and equipment (net) 291,200 207,200 Total assets $978,880 $781,760 Liabilities and Stockholders' Equity Notes payable (current) $190,400 $134,400 Accounts payable 72,800 58,240 Accrued liabilities 44.800 44,800 280,000 190,400 Bonds payable, due 2025 Common stock, $10 par 224,000 224,000 Retained earnings 166,880 129,920 Total liabilities and stockholders' equity $978,880 $781,760 Oriole Company Income Statement For the Years Ended December 31 2022 2021 Net sales $987,840 $884,800 Cost of goods sold 716,800 644,000 Gross profit 271,040 240,800 Operating expenses 212,800 187,040 Net income $ 58,240 $53.760 Additional information: 1. 2. Inventory at the beginning of 2021 was $128,800. Accounts receivable (net) at the beginning of 2021 were $96,320. Total assets at the beginning of 2021 were $739,200. 3. 4. No common stock transactions occurred during 2021 or 2022. 5. All sales were on credit. Indicate, by using ratios, the change in liquidity and profitability of Oriole Company from 2021 to 2022. (Round Current ratio, Asset turnover and Earnings per share to 2 decimal places, e.g. 1.65, and all other answers to 1 decimal place, e.g. 6.8 or 6.8%.) 2021 2022 LIQUIDITY Current ratio 1.8 :1 1.8 :1 Accounts receivable turnover 9 times 2 9 times Inventory turnover 4.11 times 3.24 times PROFITABILITY Profit margin 6 % 6 6 % Asset turnover 1.16 times 1.12 times Return on assets 7 % SO 6.62 % Earnings per share $ 2.4 $ 2.6 The following are three independent situations and a ratio that may be affected. For each situation, compute the affected ratio (1) as of December 31, 2022, and (2) as of December 31, 2023, after giving effect to the situation. (Round debt to assets ratio to O decimal places, e.g. 15% and other answers to 1 decimal place, e.g. 6.8 or 6.8%.) Situation Ratio (1) Return on common stockholders' equity (2) Debt to assets ratio 20,160 shares of common stock were sold at par on July 1, 2023. Net income for 2023 was $60,480, and there were no dividends. All of the notes payable were paid in 2023. All other liabilities remained at their December 31, 2022, levels. At December 31, 2023, total assets were $1.008.000. The market price of common stock was $10 and $13 on December 31, 2022 and 2023, respectively. Net income for 2023 was $60,480. (Use a simple average calculation for EPS.) (3) Price-earnings ratio 2022 2023 Return on common stockholders' equity % % Debt to assets ratio % % Price-earnings ratio times times Save for Later Attempts: 0 of 3 used Submit
Step by Step Solution
There are 3 Steps involved in it

Get step-by-step solutions from verified subject matter experts