

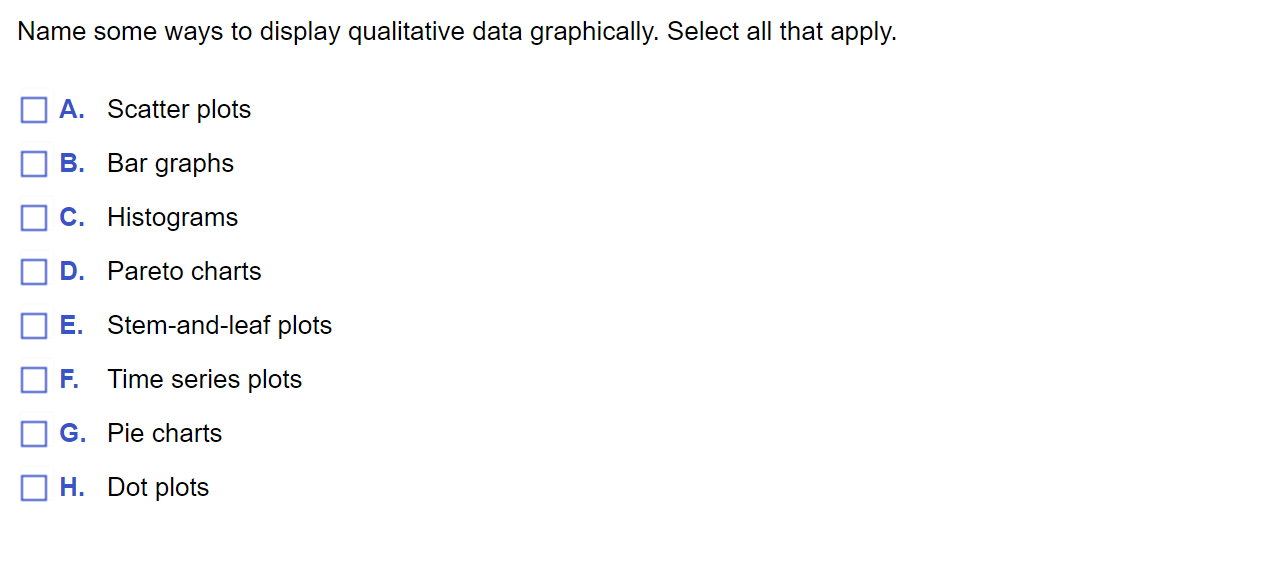
Question: answer Name some ways to display qualitative data graphically. Select all that apply. A. Scatter plots B. Bar graphs c. Histograms D. Pareto charts E.
answer
Step by Step Solution
There are 3 Steps involved in it
1 Expert Approved Answer
Step: 1 Unlock

Question Has Been Solved by an Expert!
Get step-by-step solutions from verified subject matter experts
Step: 2 Unlock
Step: 3 Unlock