

Question: ANSWER NEEDED IN THE NEXT HOUR PLEASE. Mathematica is used for the following problem. I was able to do parts (a) and (b), but I'm
ANSWER NEEDED IN THE NEXT HOUR PLEASE.
Mathematica is used for the following problem. I was able to do parts (a) and (b), but I'm having trouble with (c), (d), and (e). Please show all your code and explain your answers, especially for part (e). Thank you!
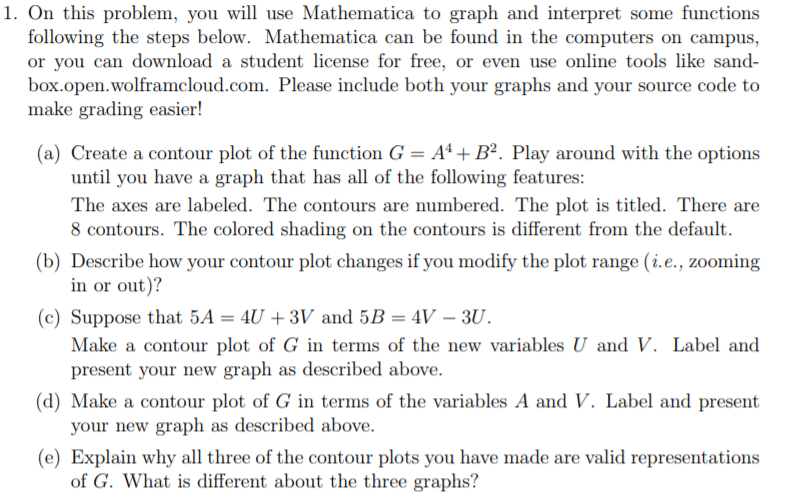
1. On this problem, you will use Mathematica to graph and interpret some functions following the steps below. Mathematica can be found in the computers on campus, or vou can download a student license for free, or even use online tools like sand- box.open.wolframcloud.com. Please include both your graphs and your source code to make grading easier! (a) Create a contour plot of the function G = 44 F. Play around with the options The axes are labeled. The contours are numbered. The plot is titled. There are (b) Describe how your contour plot changes if you modify the plot range (i.e., zooming until you have a graph that has all of the following features: 8 contours. The colored shading on the contours is different from the default. in or out)? (c) Suppose that 5A-4U +3V and 5B 4V-3U Make a contour plot of G in terms of the new variables U and V. Label and (d) Make a contour plot of G in terms of the variables A and V. Label and present (e) Explain why all three of the contour plots you have made are valid representations present your new graph as described above. your new graph as described above. of G. What is different about the three graphs? 1. On this problem, you will use Mathematica to graph and interpret some functions following the steps below. Mathematica can be found in the computers on campus, or vou can download a student license for free, or even use online tools like sand- box.open.wolframcloud.com. Please include both your graphs and your source code to make grading easier! (a) Create a contour plot of the function G = 44 F. Play around with the options The axes are labeled. The contours are numbered. The plot is titled. There are (b) Describe how your contour plot changes if you modify the plot range (i.e., zooming until you have a graph that has all of the following features: 8 contours. The colored shading on the contours is different from the default. in or out)? (c) Suppose that 5A-4U +3V and 5B 4V-3U Make a contour plot of G in terms of the new variables U and V. Label and (d) Make a contour plot of G in terms of the variables A and V. Label and present (e) Explain why all three of the contour plots you have made are valid representations present your new graph as described above. your new graph as described above. of G. What is different about the three graphs
Step by Step Solution
There are 3 Steps involved in it

Get step-by-step solutions from verified subject matter experts