

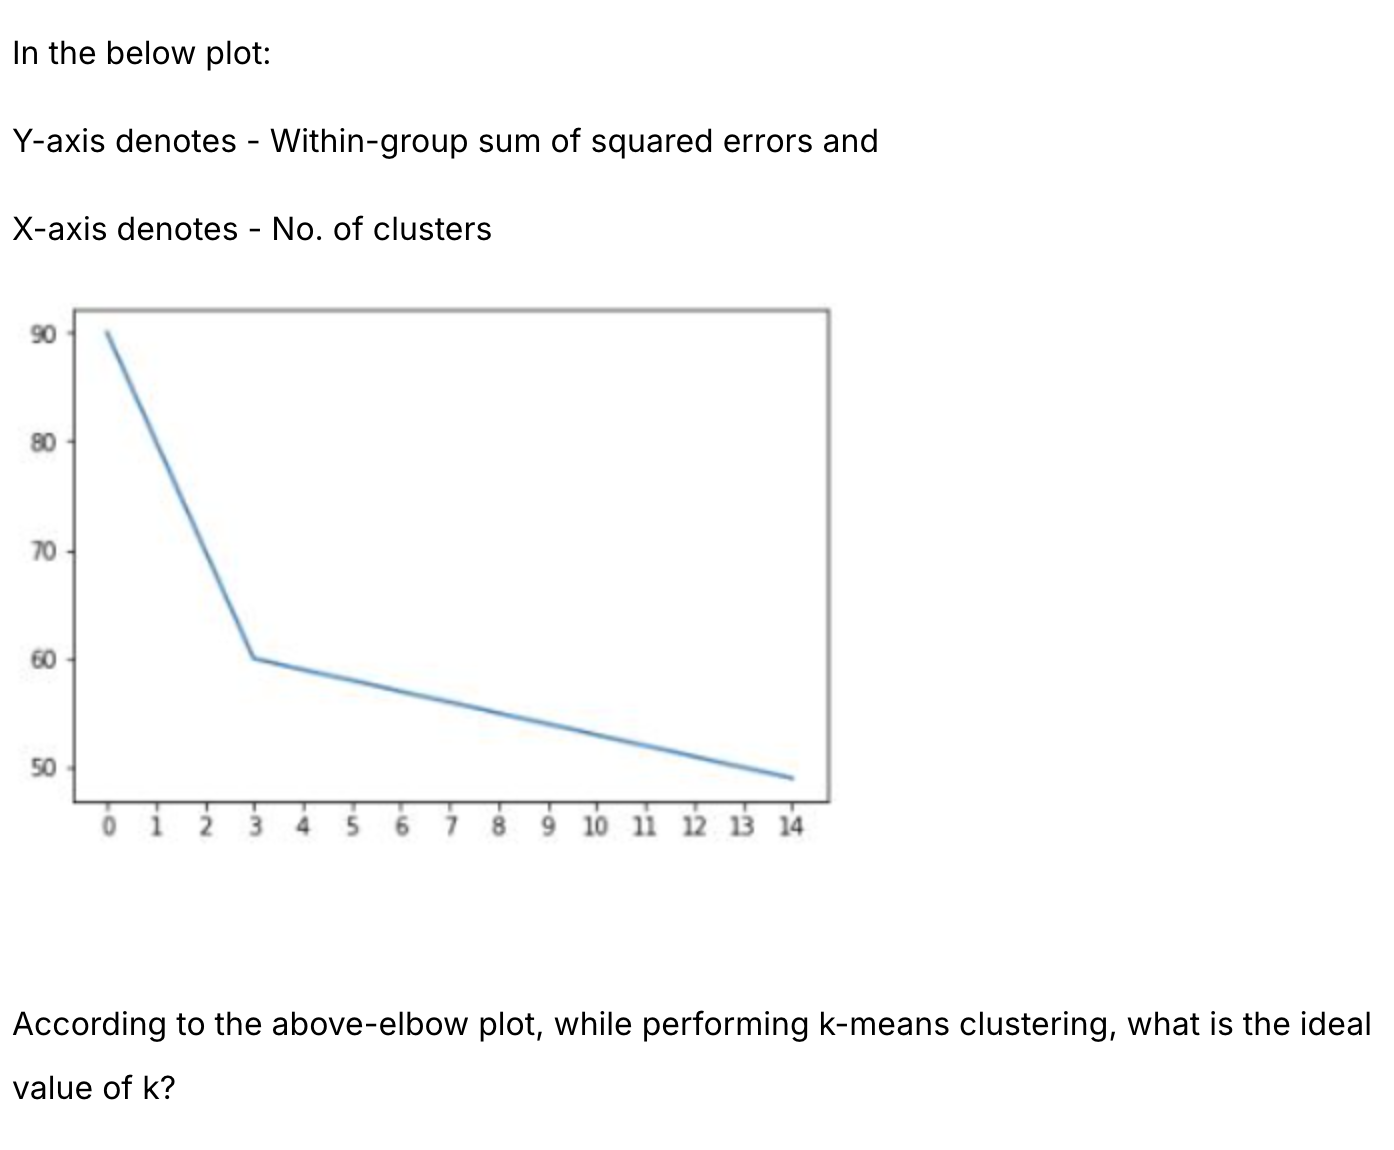
Question: answer of the question In the below plot: Y-axis denotes - Within-group sum of squared errors and X-axis denotes - No. of clusters 90 80
answer of the question
Step by Step Solution
There are 3 Steps involved in it
1 Expert Approved Answer
Step: 1 Unlock

Question Has Been Solved by an Expert!
Get step-by-step solutions from verified subject matter experts
Step: 2 Unlock
Step: 3 Unlock