

Question: answer only question 3 AutoSave C - Glos Demand forecasting Fire Exercise NEF (1) Excel Scarch Rajesh Dip File Home Insert Page Layout Formulas Data
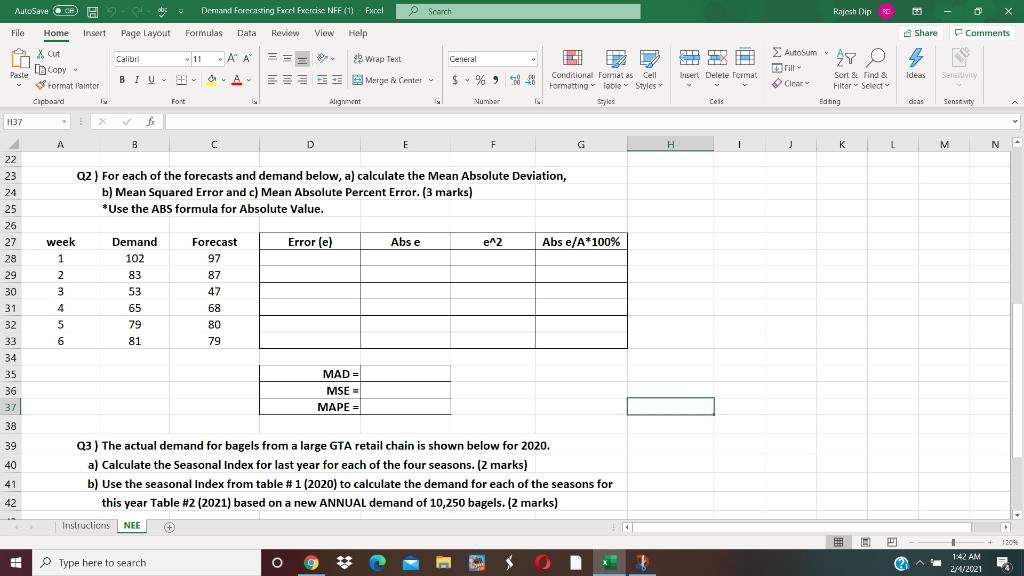
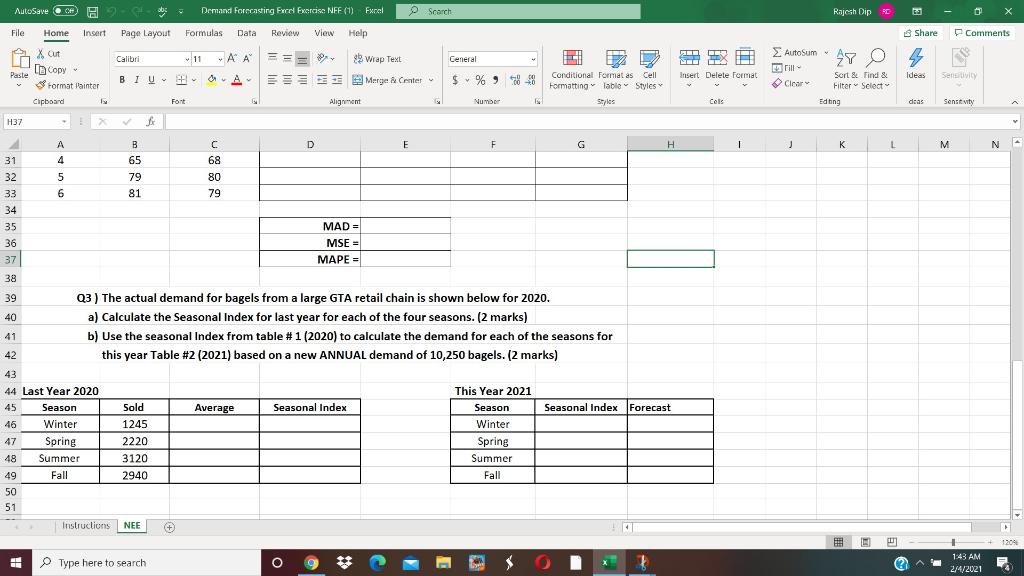
answer only question 3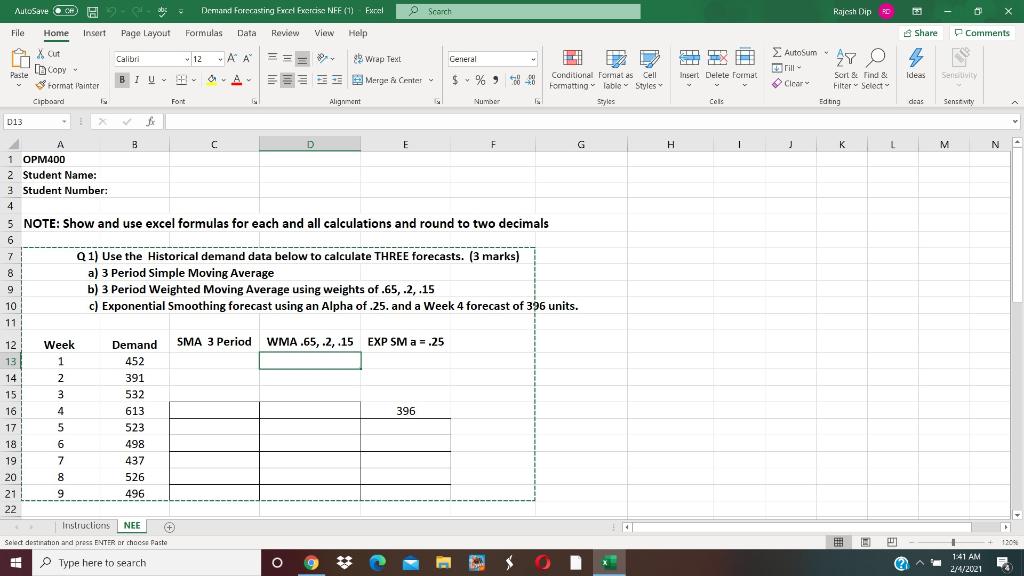

Step by Step Solution
There are 3 Steps involved in it
1 Expert Approved Answer
Step: 1 Unlock

Question Has Been Solved by an Expert!
Get step-by-step solutions from verified subject matter experts
Step: 2 Unlock
Step: 3 Unlock