

Question: Answer options for 2 b) is or is not . Thank you for your time. 1 of 1 ID: MST.FET.CP.DTPP.01.0030A [1 mark] This question relates
Answer options for 2 b) is or is not. Thank you for your time.
![your time. 1 of 1 ID: MST.FET.CP.DTPP.01.0030A [1 mark] This question relates](https://dsd5zvtm8ll6.cloudfront.net/si.experts.images/questions/2024/09/66ef1a2952300_83266ef1a28f0313.jpg)
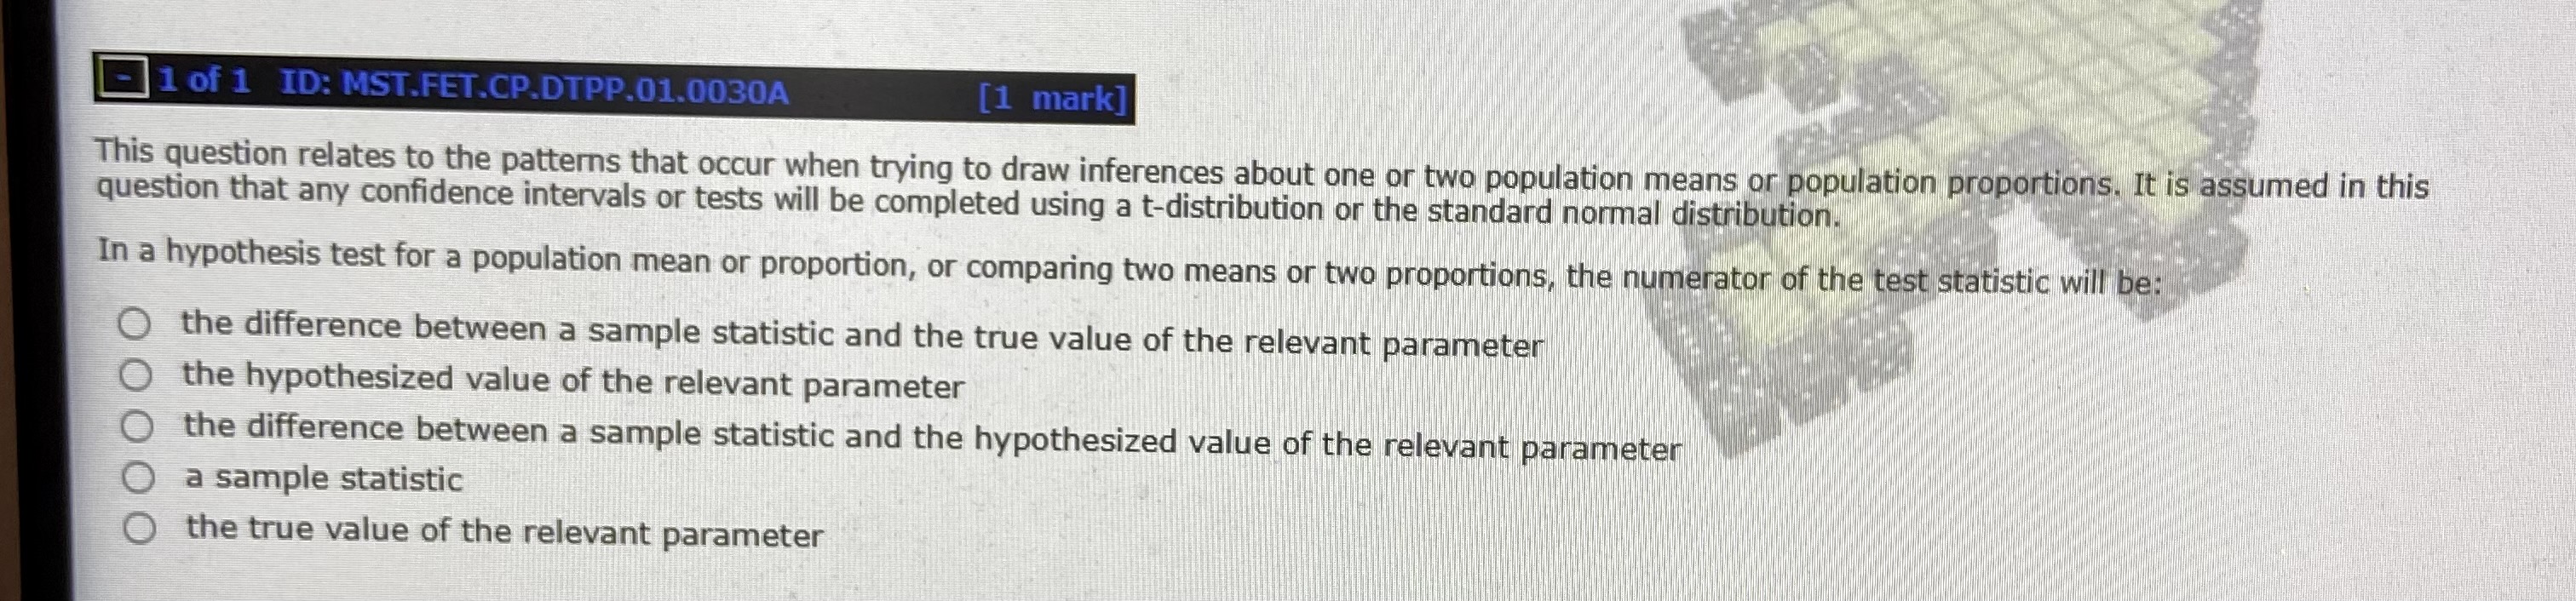
1 of 1 ID: MST.FET.CP.DTPP.01.0030A [1 mark] This question relates to the patterns that occur when trying to draw inferences about one or two population means or population proportions. It is assumed in this question that any confidence intervals or tests will be completed using a t-distribution or the standard normal distribution. In a hypothesis test for a population mean or proportion, or comparing two means or two proportions, the numerator of the test statistic will be: the difference between a sample statistic and the true value of the relevant parameter O the hypothesized value of the relevant parameter O the difference between a sample statistic and the hypothesized value of the relevant parameter O a sample statistic the true value of the relevant parameter1 of 2 ID: MST.FET.CP.ITPP.01.0010A [2 marks] Two separate marketing teams, Team A and Team B, have each designed a 30 second advertisement for the new Cloak soft drink. The manager of marketing is interested to see if there is any difference between the effectiveness of the two ads. A random sample of 50 people are shown the ad from Team A and asked if they would definitely buy the new drink. In this sample, 15 people said that they would. A second random sample of 50 people are shown the ad from Team B and asked if they would definitely buy the drink. In this sample, 12 people said that they would. Let It 1 denote the population proportion of people that would definitely buy the drink if they saw the ad from Team A. Let T2 denote the population proportion of people that would definitely buy the drink if they saw the ad from Team B. A hypothesis test is conducted with the following hypotheses: Ho: T 1 - T 2 HA: It 1 + TL 2 The level of significance used in this test is 0.05. You may find this standard normal table useful. a) Calculate the test statistic (z) for this test. Give your answer to 2 decimal places. Z = b) In this test the null hypothesis | rejected. 2 of 2 ID: MST.FET.CP.ITPP.02.0020A [2 marks] A computer training group would like to compare the effectiveness of two modes of training. The first mode of training is a short 20 minute interactive one-on-one tutorial with the participant and the second mode is a one hour video that the participant watches. A random sample of 68 people are invited to take part in the tutorial, which is followed by a test to measure competency at the tasks covered. The number of people that pass this test is 33. Similarly, a random sample of 48 people are invited to watch the video, which is also followed by the same test. The number of people that pass this test is 23. Let Ty denote the population proportion of people that would pass the competency test after taking the tutorial. Similarly, let It2 denote the population proportion of people that would pass the competency test after watching the video. Construct a 95% confidence interval for the difference between these two proportions (TI 1 - T 2). Give your answers to 3 decimal places. You may find this standard normal table useful. ST.1 - T2 s
Step by Step Solution
There are 3 Steps involved in it

Get step-by-step solutions from verified subject matter experts