

Question: answer part 1-4 Section 12 A study from 2002 analyzed accident data to determine the frequency of fatal and non-fatal accidents among sexes for drivers
answer part 1-4
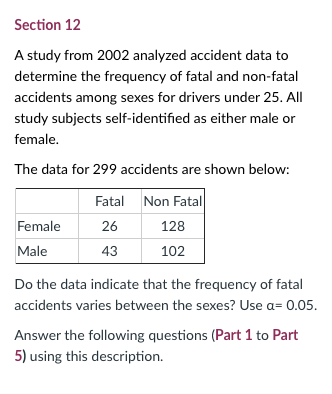
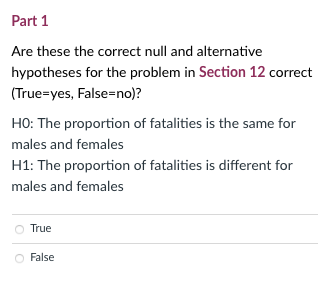
Section 12 A study from 2002 analyzed accident data to determine the frequency of fatal and non-fatal accidents among sexes for drivers under 25. All study subjects self-identified as either male or female. The data for 299 accidents are shown below: Fatal Non Fatal Female 26 128 Male 43 102 Do the data indicate that the frequency of fatal accidents varies between the sexes? Use a= 0.05. Answer the following questions (Part 1 to Part 5) using this description.Part 1 Are these the correct null and alternative hypotheses for the problem in Section 12 correct (True=yes, False=no)? HO: The proportion of fatalities is the same for males and females H1: The proportion of fatalities is different for males and females O True O FalsePart 2 To find out if the frequency of fatal accidents varies between the sexes at a= 0.05, what is the value of the test statistic you obtained?Part 3 To find out if the frequency of fatal accidents varies between the sexes at a= 0.05, what critical value would you use?Part 4 Based on your answers in Part 1 to Part 3, is the following statement correct (True)? We reject the null hypothesis, and conclude that the proportion of fatalities is not the same for males and females. O True O False
Step by Step Solution
There are 3 Steps involved in it

Get step-by-step solutions from verified subject matter experts