

Question: Answer parts a,b,c,d,e,f, and g using the made up data at the top of the first picture Q3: July August, Sept 04: Oct, Nov, Dec
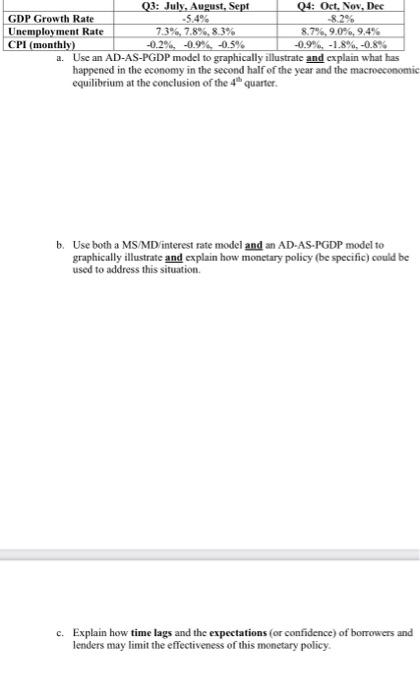
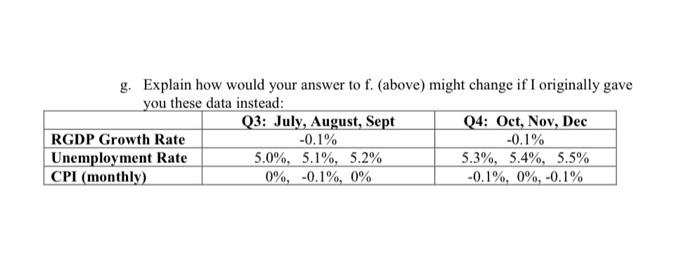
Q3: July August, Sept 04: Oct, Nov, Dec GDP Growth Rate -5.4% Unemployment Rate 7.3%, 7.8% 83% 8.7%, 9.0%, 9.4% CPI (monthly) -0.2% -0.9% -0,5% -0.9% -1.8%,-0.8% a. Use an AD-AS-PGDP model to graphically illustrate and explain what has happened in the economy in the second half of the year and the macroeconomic equilibrium at the conclusion of the quarter. b. Use both a MS/MD interest rate model and an AD-AS-PGDP model to graphically illustrate and explain how monetary policy (be specific) could be used to address this situation. c. Explain how time lags and the expectations (or confidence) of borrowers and lenders may limit the effectiveness of this monetary policy d. Use an AD-AS-PGDP model to graphically illustrate and explain how automatic and discretionary fiscal policy (be specific) could be used to address this situatice c. Explain how time lags and crowding out could limit the effectiveness of this fiscal policy 1. Given what you have learned in this unit, what type of policy would be most effective at restoring full employment in this situation automatic fiscal policy, discretionary fiscal policy, or monetary policy? Or a combination? Thoroughly discuss the relative strengths and weaknesses of each of these 3 policies to support your explanation g. Explain how would your answer to f. (above) might change if I originally gave you these data instead: Q3: July, August, Sept Q4: Oct, Nov, Dec RGDP Growth Rate -0.1% -0.1% Unemployment Rate 5.0%, 5.1%, 5.2% 5.3%, 5.4%, 5.5% CPI (monthly) 0%, -0.1%, 0% -0.1%, 0%, -0.1% Q3: July August, Sept 04: Oct, Nov, Dec GDP Growth Rate -5.4% Unemployment Rate 7.3%, 7.8% 83% 8.7%, 9.0%, 9.4% CPI (monthly) -0.2% -0.9% -0,5% -0.9% -1.8%,-0.8% a. Use an AD-AS-PGDP model to graphically illustrate and explain what has happened in the economy in the second half of the year and the macroeconomic equilibrium at the conclusion of the quarter. b. Use both a MS/MD interest rate model and an AD-AS-PGDP model to graphically illustrate and explain how monetary policy (be specific) could be used to address this situation. c. Explain how time lags and the expectations (or confidence) of borrowers and lenders may limit the effectiveness of this monetary policy d. Use an AD-AS-PGDP model to graphically illustrate and explain how automatic and discretionary fiscal policy (be specific) could be used to address this situatice c. Explain how time lags and crowding out could limit the effectiveness of this fiscal policy 1. Given what you have learned in this unit, what type of policy would be most effective at restoring full employment in this situation automatic fiscal policy, discretionary fiscal policy, or monetary policy? Or a combination? Thoroughly discuss the relative strengths and weaknesses of each of these 3 policies to support your explanation g. Explain how would your answer to f. (above) might change if I originally gave you these data instead: Q3: July, August, Sept Q4: Oct, Nov, Dec RGDP Growth Rate -0.1% -0.1% Unemployment Rate 5.0%, 5.1%, 5.2% 5.3%, 5.4%, 5.5% CPI (monthly) 0%, -0.1%, 0% -0.1%, 0%, -0.1%
Step by Step Solution
There are 3 Steps involved in it

Get step-by-step solutions from verified subject matter experts