

Question: answer piease 3. The following boxplot shows the 2012 season runs batted in (RBIs) of 280 American League batters (the top 280 batters in terms
answer piease
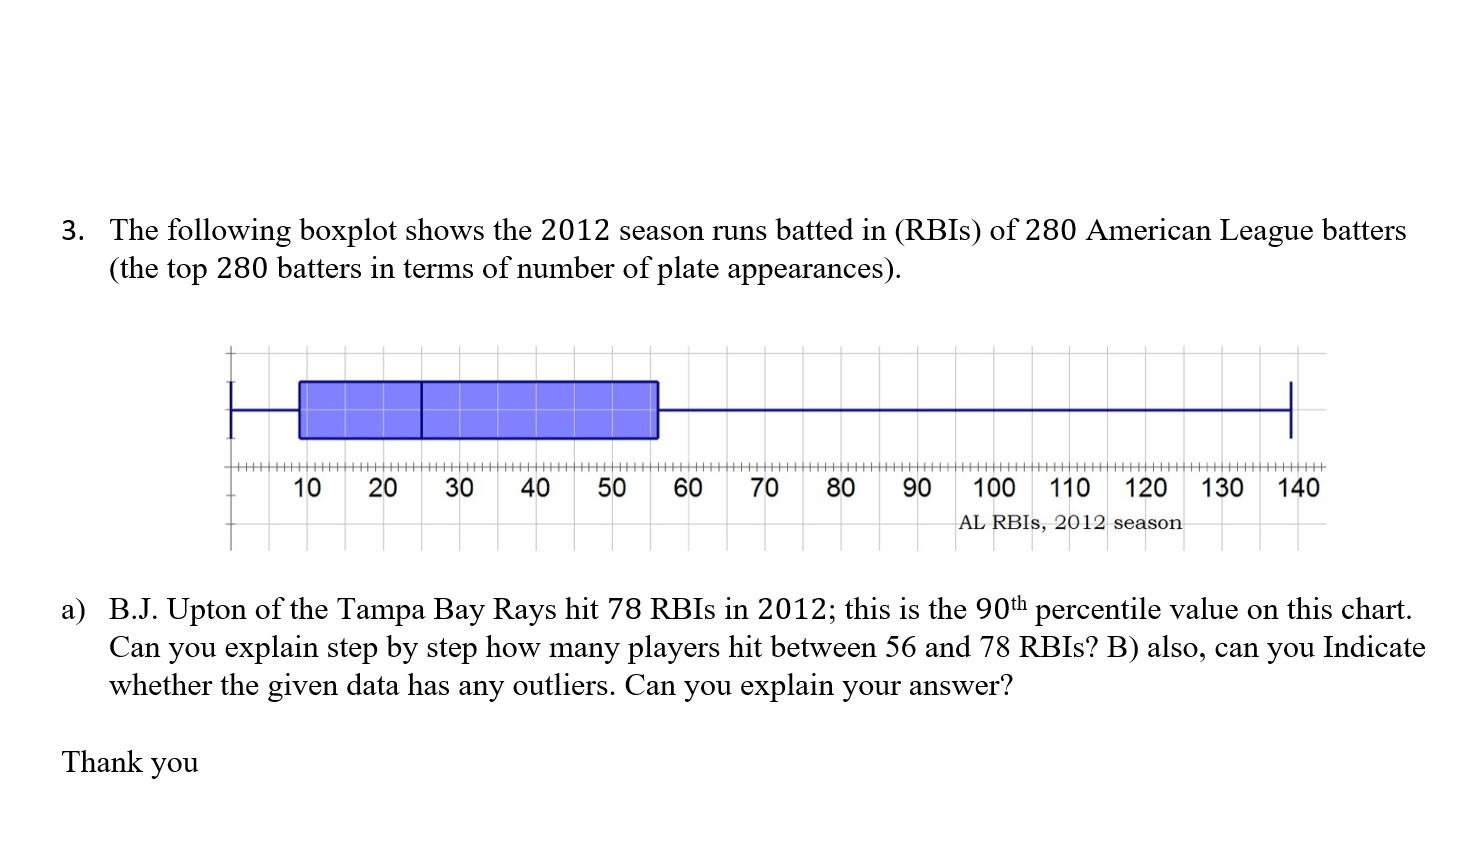 3. The following boxplot shows the 2012 season runs batted in (RBIs) of 280 American League batters (the top 280 batters in terms of number of plate appearances). 10 20 30 40 50 60 70 80 90 100 110 120 130 140 AL RBIs, 2012 season a) B.J. Upton of the Tampa Bay Rays hit 78 RBIs in 2012; this is the 90th percentile value on this chart. Can you explain step by step how many players hit between 56 and 78 RBIs? B) also, can you Indicate whether the given data has any outliers. Can you explain your answer? Thank you
 Step by Step Solution
There are 3 Steps involved in it
1 Expert Approved Answer
Step: 1 Unlock

Question Has Been Solved by an Expert!
Get step-by-step solutions from verified subject matter experts
Step: 2 Unlock
Step: 3 Unlock