

Question: Answer please 3- Values of experimental variograms are represented for each lag h, in table 3,. Which variogram model fits better to these experimental values
Answer please
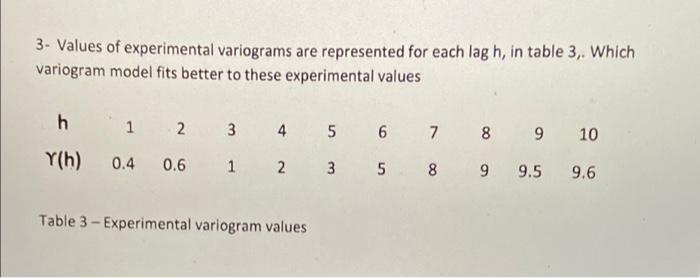
3- Values of experimental variograms are represented for each lag h, in table 3,. Which variogram model fits better to these experimental values h 1 2 3 4 5 6 7 8 9 10 Y(h) 0.4 0.6 1 2 3 5 8 9 9.5 9.6 Table 3 - Experimental variogram values
Step by Step Solution
There are 3 Steps involved in it
1 Expert Approved Answer
Step: 1 Unlock

Question Has Been Solved by an Expert!
Get step-by-step solutions from verified subject matter experts
Step: 2 Unlock
Step: 3 Unlock