

Question: Answer please? Consider Figure D (below). Figure D 40 35 Body Mass Index 5 10 15 20 25 Years of School C. (2 pts.) Using
Answer please?
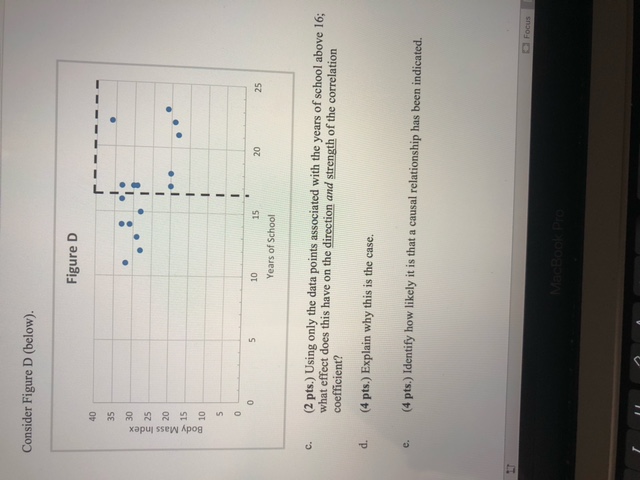
Consider Figure D (below). Figure D 40 35 Body Mass Index 5 10 15 20 25 Years of School C. (2 pts.) Using only the data points associated with the years of school above 16; what effect does this have on the direction and strength of the correlation coefficient? d. (4 pts.) Explain why this is the case. C. (4 pts.) Identify how likely it is that a causal relationship has been indicated. FOCUS MacBook Pro
Step by Step Solution
There are 3 Steps involved in it
1 Expert Approved Answer
Step: 1 Unlock

Question Has Been Solved by an Expert!
Get step-by-step solutions from verified subject matter experts
Step: 2 Unlock
Step: 3 Unlock