

Question: answer please Fit a multiple regression model using either MS Excel or SPSS and interpret the resulting output explaining all the table parameters. Include all
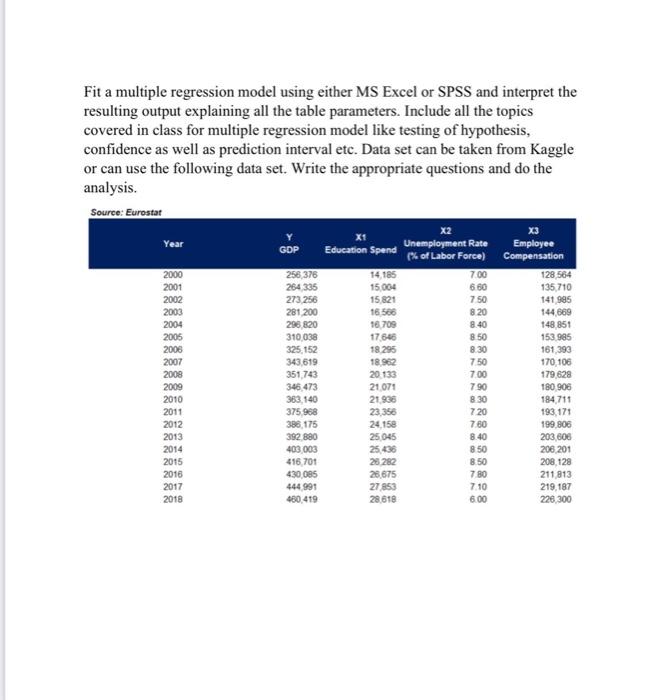
Fit a multiple regression model using either MS Excel or SPSS and interpret the resulting output explaining all the table parameters. Include all the topics covered in class for multiple regression model like testing of hypothesis, confidence as well as prediction interval etc. Data set can be taken from Kaggle or can use the following data set. Write the appropriate questions and do the analysis. Source: Eurostat X1 Education Spend GDP X2 Unemployment Rate (% of Labor Force) Employee Compensation 14,185 7.00 128,564 15,004 6.60 135,710 15,821 7.50 141,985 16,566 8.20 144,669 16,709 8.40 148,851 17,646 8.50 153,985 18,295 8.30 161,393 18,962 7.50 170,106 20,133 7.00 179,628 21,071 7.90 180,906 21,936 8.30 184,711 23,356 720 193,171 24,158 7.60 199,806 25,045 8.40 203,606 25,436 8:50 206,201 26,282 8.50 208,128 26,675 7.80 211,813 27,853 7.10 219,187 28,618 6.00 226,300 Year 2000 2001 2002 2003 2004 2005 2006 2007 2008 2009 2010 2011 2012 2013 2014 2015 2016 2017 2018 256,376 264,335 273,256 281,200 296,820 310,038 325,152 343,619 351,743 346,473 363,140 375,968 386,175 392,880 403,003 416,701 430,005 444,991 460,419
Step by Step Solution
There are 3 Steps involved in it

Get step-by-step solutions from verified subject matter experts