

Question: Answer please MyLab and M - C mathxl.com/Student/PlayerHomework.aspx?homeworkld=618602454&q # Apps G Gmall Ry Maps YouTube X 4 How to Unlock Dis... & MY Account @
Answer please
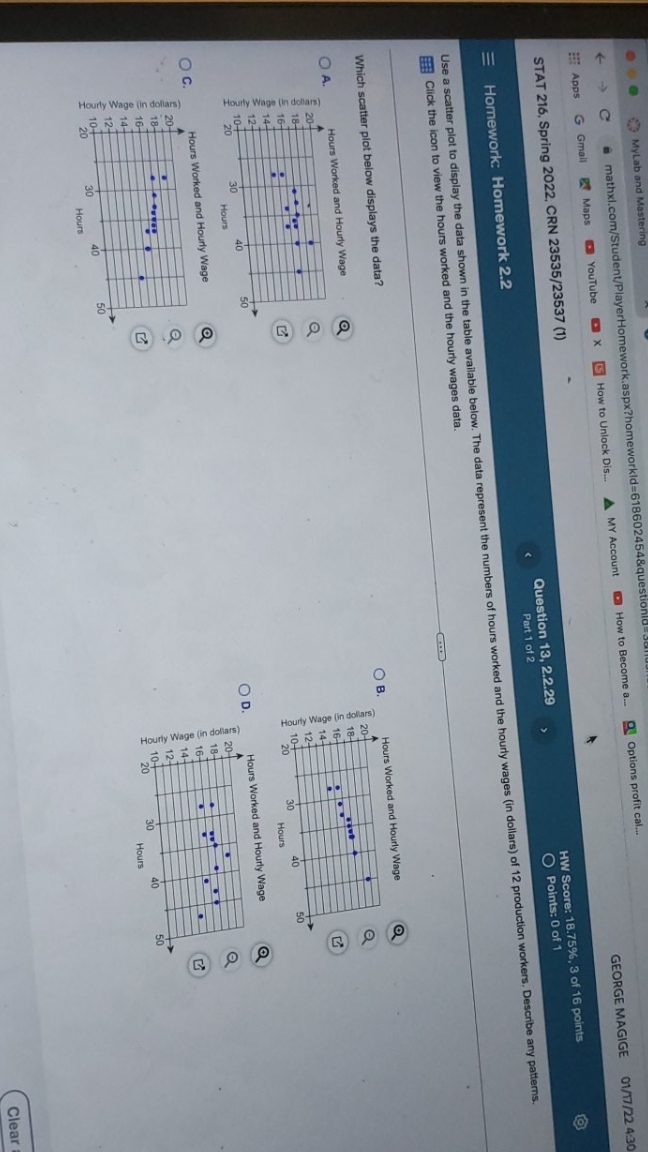
MyLab and M - C mathxl.com/Student/PlayerHomework.aspx?homeworkld=618602454&q # Apps G Gmall Ry Maps YouTube X 4 How to Unlock Dis... & MY Account @ How to Become a.. Q Options profit cal.. STAT 216, Spring 2022, CRN 23535/23537 (1) GEORGE MAGIGE 01/17/22 4:30 Homework: Homework 2.2 Question 13, 2.2.29 HW Score: 18.75%, 3 of 16 points Part 1 of 2 O Points: 0 of 1 Use a scatter plot to display the data shown in the table available below. The data represent the numbers of hours worked and the hourly wages (in dollars) of 12 production workers. Describe any patterns, Eff Click the icon to view the hours worked and the hourly wages data. Which scatter plot below displays the data? OA. Hours Worked and Hourly Wage OB. Hours Worked and Hourly Wage 20- 20- of Hourly Wage (in dollars) Hourly Wage (in dollars) 10- 10 20 30 20 30 40 Hours Hours O C. Hours Worked and Hourly Wage OD. Hours Worked and Hourly Wage Hourly Wage (in dollars) Hourly Wage (in dollars) 10- S 40 Hours Hours Clear
Step by Step Solution
There are 3 Steps involved in it

Get step-by-step solutions from verified subject matter experts