

Question: Answer please You are at a table at a casino with a gambling game. In the game you spin two spinners. Spinner #1 has 4
Answer please
You are at a table at a casino with a gambling game. In the game you spin two spinners. Spinner #1 has 4 equal spaces numbered 1,2,3,4. Spinner #2, has only two equal spaces with the numbers 1 and 3.To play the game, you have to pay $4 dollars. Regardless of whether you win or lose you have to pay the $4. There are two different bets you can make that are related to the sum of the two spins (number from Spinner #1 + number from Spinner #2).Shown below are the two different bets and amounts associated with winning each.
Bet 1: You win $8 if the sum of Spinner #1 and Spinner #2 is less than 5
Bet 2: You win $12 if the sum of Spinner #1 and Spinner #2 is greater than 5
What is the sample space? Hint: this is the number of different outcomes where order does matter. So getting a 1 on Spinner #1 and 3 on Spinner #2 is a distinct outcome from the reverse.
What is the probability of winning Bet 1? What is the probability of winning Bet 2?
What is the expected value of Bet 1? What is the expected value of Bet 2? Which is the better bet? Would you break even (i.e. not lose any money) with either bet?
For Bet 2, how much would you have to earn to exactly break even (neither lose nor win money in expectation)?
Now imagine for Bet 1 you only have to pay the $4 to play if you lose. What is the expected value of Bet 1 now? Would you break even?
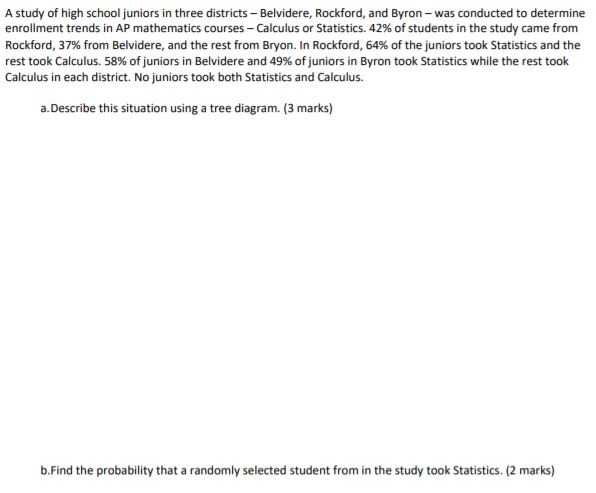
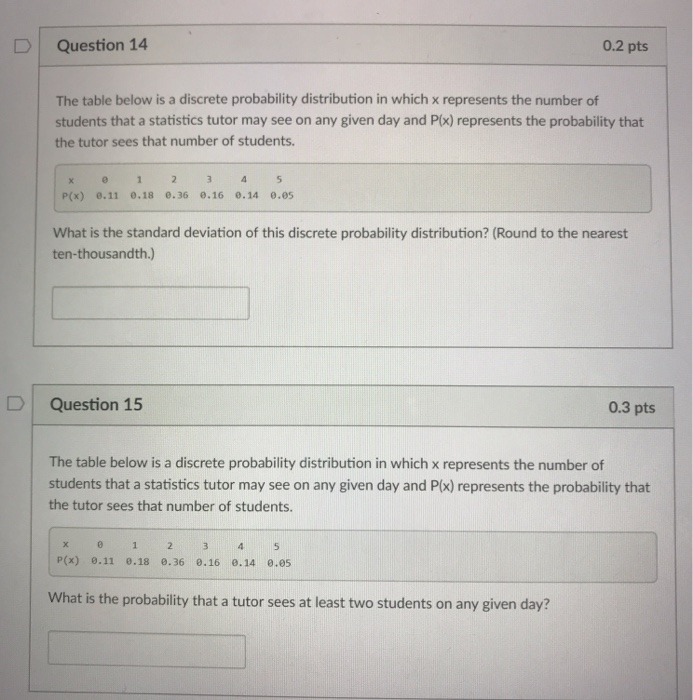
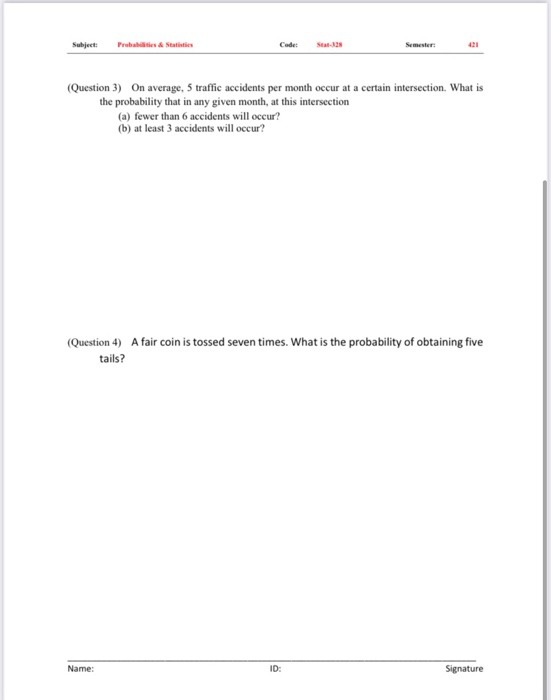
A study of high school juniors in three districts - Belvidere, Rockford, and Byron - was conducted to determine enrollment trends in AP mathematics courses - Calculus or Statistics. 42% of students in the study came from Rockford, 37% from Belvidere, and the rest from Bryon. In Rockford, 64%% of the juniors took Statistics and the rest took Calculus. 58% of juniors in Belvidere and 49% of juniors in Byron took Statistics while the rest took Calculus in each district. No juniors took both Statistics and Calculus. a. Describe this situation using a tree diagram. (3 marks) b.Find the probability that a randomly selected student from in the study took Statistics. (2 marks)D Question 14 0.2 pts The table below is a discrete probability distribution in which x represents the number of students that a statistics tutor may see on any given day and P(x) represents the probability that the tutor sees that number of students. 1 2 3 4 5 P(x) 0.11 0.18 0.36 0.16 0. 14 0.05 What is the standard deviation of this discrete probability distribution? (Round to the nearest ten-thousandth.) D Question 15 0.3 pts The table below is a discrete probability distribution in which x represents the number of students that a statistics tutor may see on any given day and P(x) represents the probability that the tutor sees that number of students. P(x) 0.11 0.18 0.36 0.16 0.14 0.05 What is the probability that a tutor sees at least two students on any given day?Subject: Code: Semester: (Question 3) On average, 5 traffic accidents per month occur at a certain intersection. What is the probability that in any given month, at this intersection (a) fewer than 6 accidents will occur? (b) at least 3 accidents will occur? (Question 4) A fair coin is tossed seven times. What is the probability of obtaining five tails? Name: ID: Signature
Step by Step Solution
There are 3 Steps involved in it

Get step-by-step solutions from verified subject matter experts